Fig. 6
Download original image
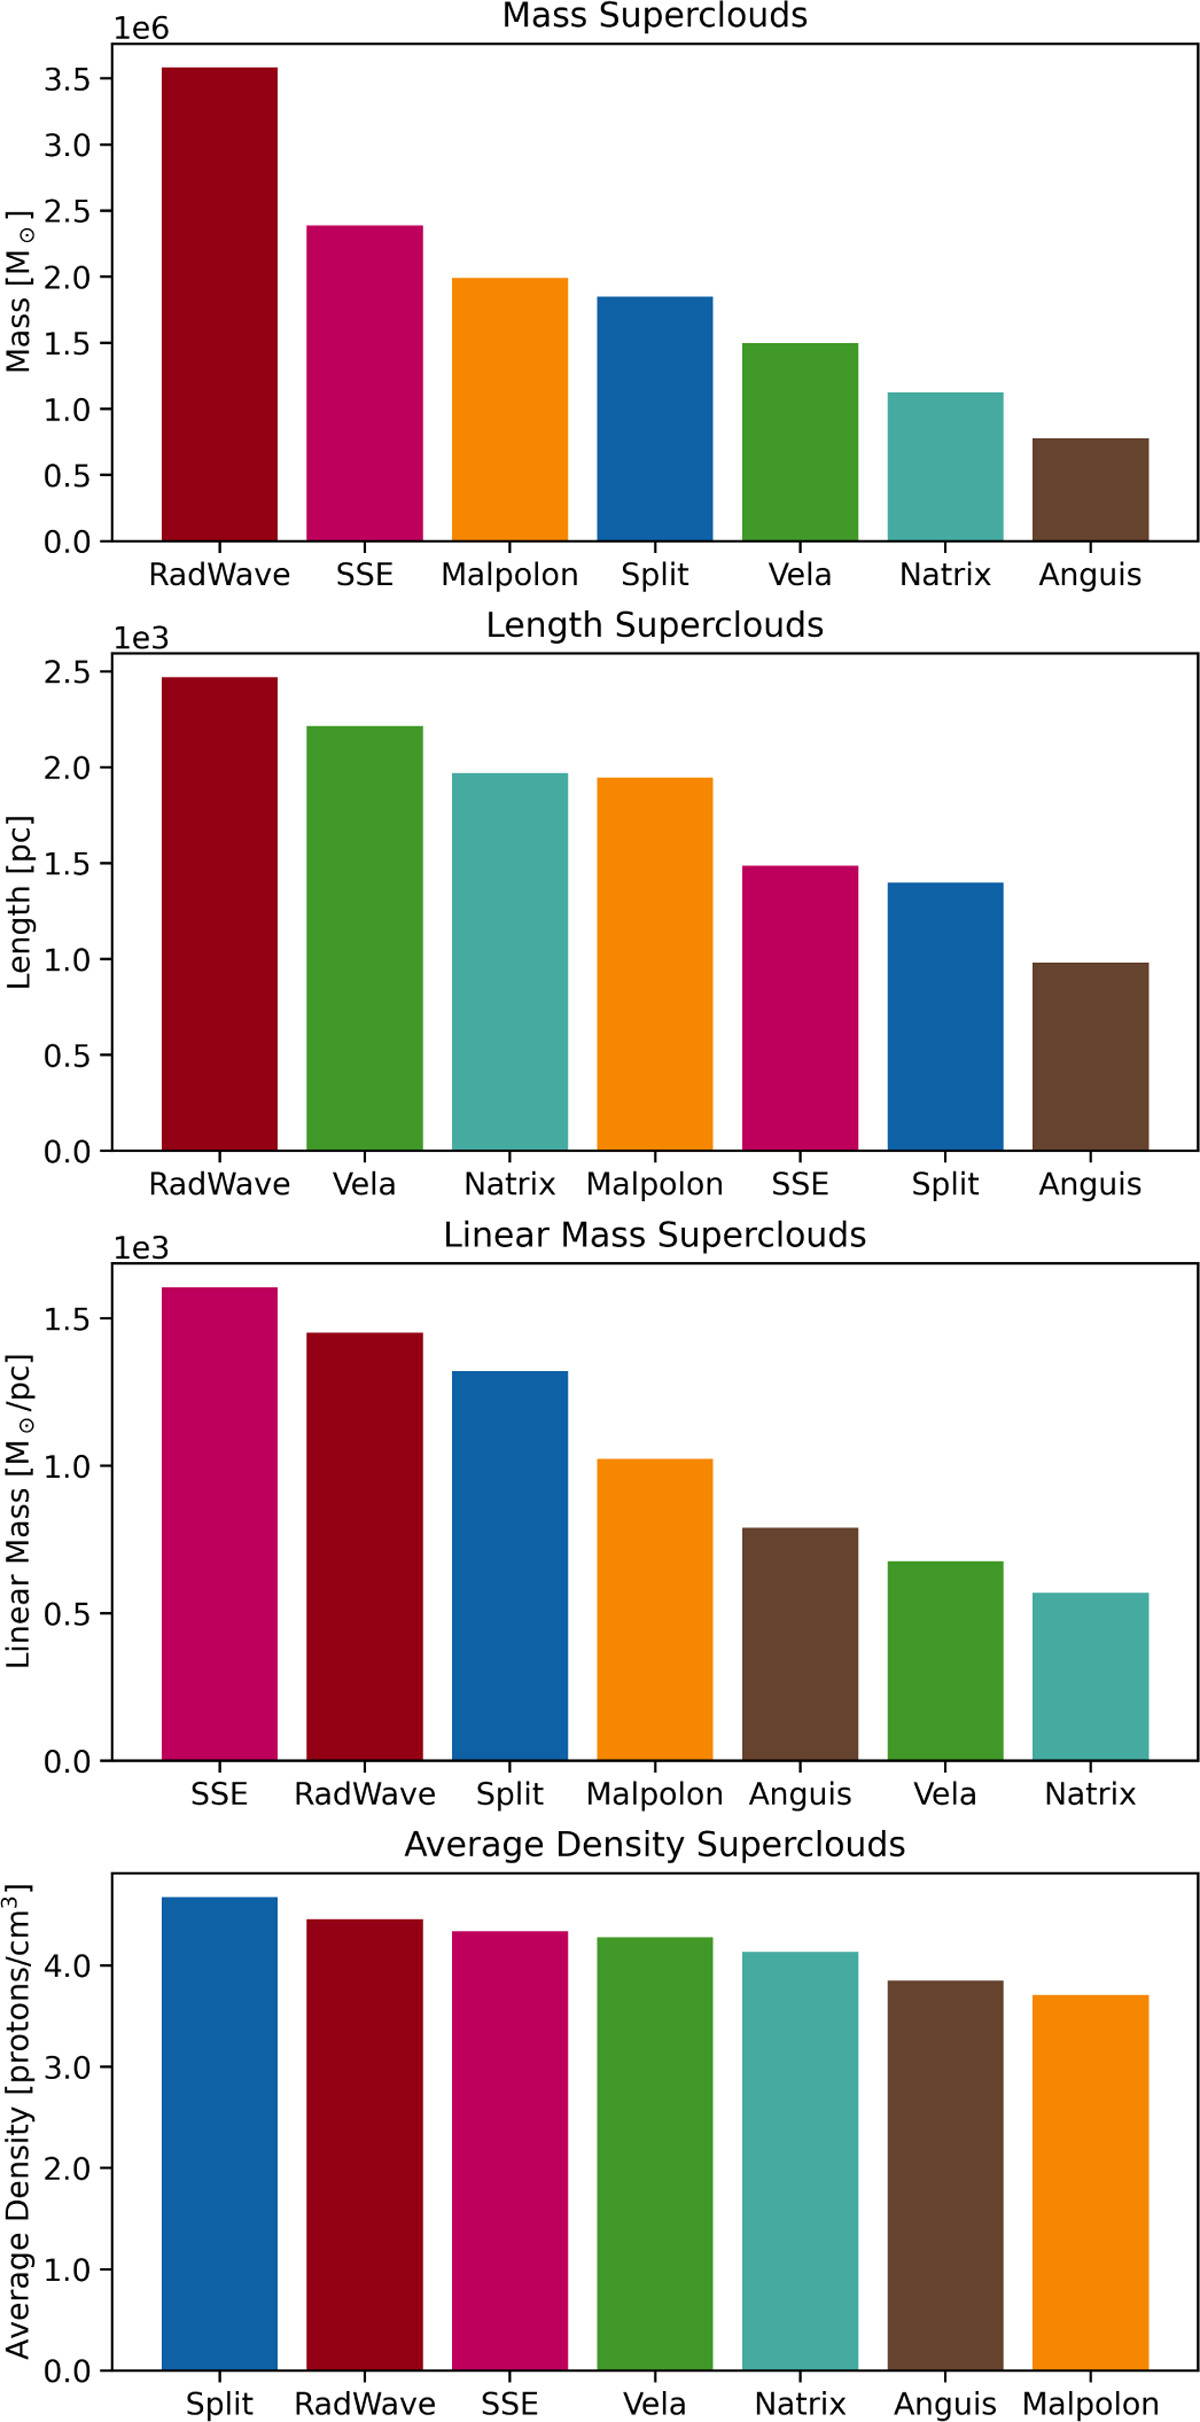
Properties calculated for the seven superclouds. The colors have the same meaning as in Fig. 4. RadWave refers to the Radcliffe Wave. Top: total mass of the superclouds. Second: total length of the super-clouds. Third: linear mass of the superclouds, the ratio of total mass to total length. Bottom: average density of the superclouds. The trends represent a lower bound, as all superclouds are incomplete and likely continue beyond the map.
Current usage metrics show cumulative count of Article Views (full-text article views including HTML views, PDF and ePub downloads, according to the available data) and Abstracts Views on Vision4Press platform.
Data correspond to usage on the plateform after 2015. The current usage metrics is available 48-96 hours after online publication and is updated daily on week days.
Initial download of the metrics may take a while.