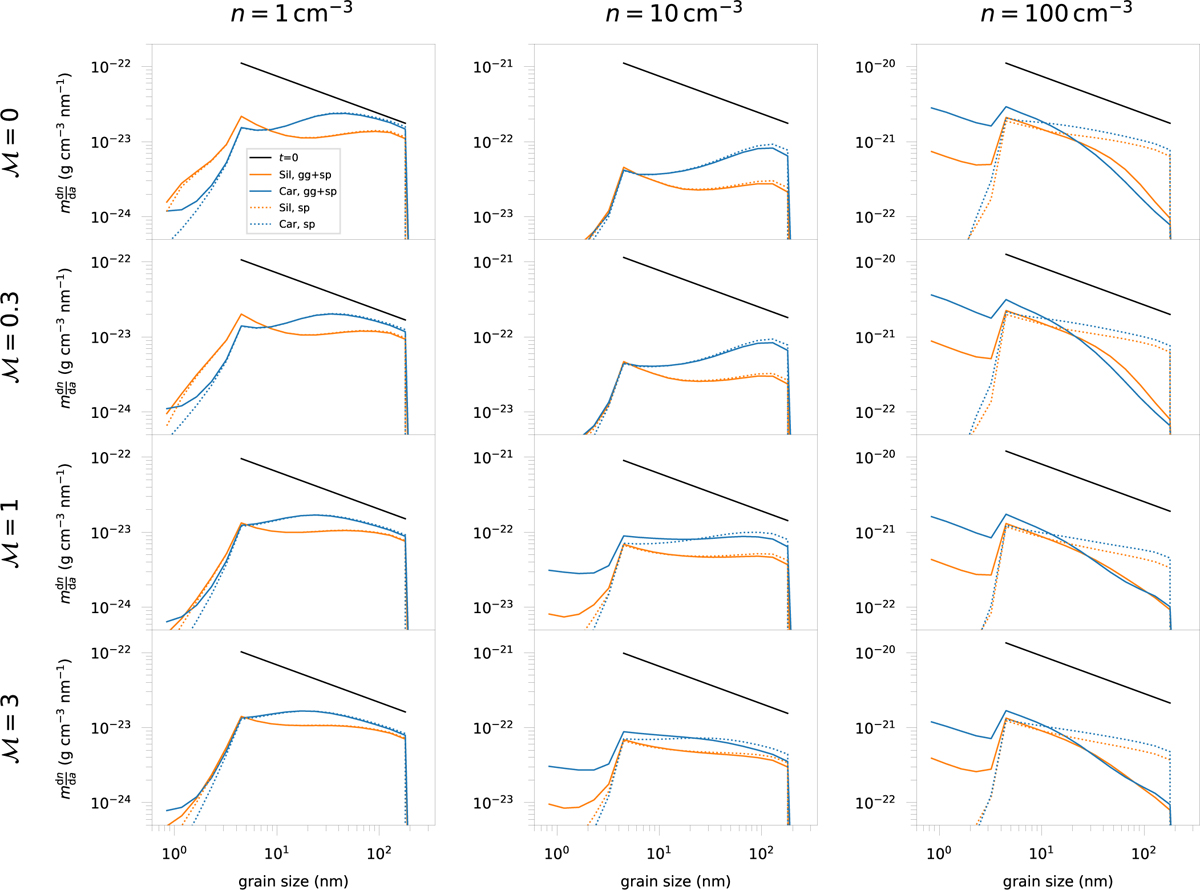
Fig. E.1
Download original image
Grain-size distributions at 10 kyr compared to the initial MRN distribution (black) for the carbonaceous and silicate grains. The y-axis represents the dust mass density per particle radius, which is the number of dust grains per volume and grain radius dn/da multiplied with the particle mass m. All z = 0 simulation parameter sets are shown, including the different considered turbulent Mach numbers (ℳ) and average ISM densities (n). The plots differentiate between carbonaceous (blue) and silicate (orange) dust, and the grain–grain collisions and sputtering (solid), and the sputtering-only (dotted) simulations.
Current usage metrics show cumulative count of Article Views (full-text article views including HTML views, PDF and ePub downloads, according to the available data) and Abstracts Views on Vision4Press platform.
Data correspond to usage on the plateform after 2015. The current usage metrics is available 48-96 hours after online publication and is updated daily on week days.
Initial download of the metrics may take a while.