Fig. A.1
Download original image
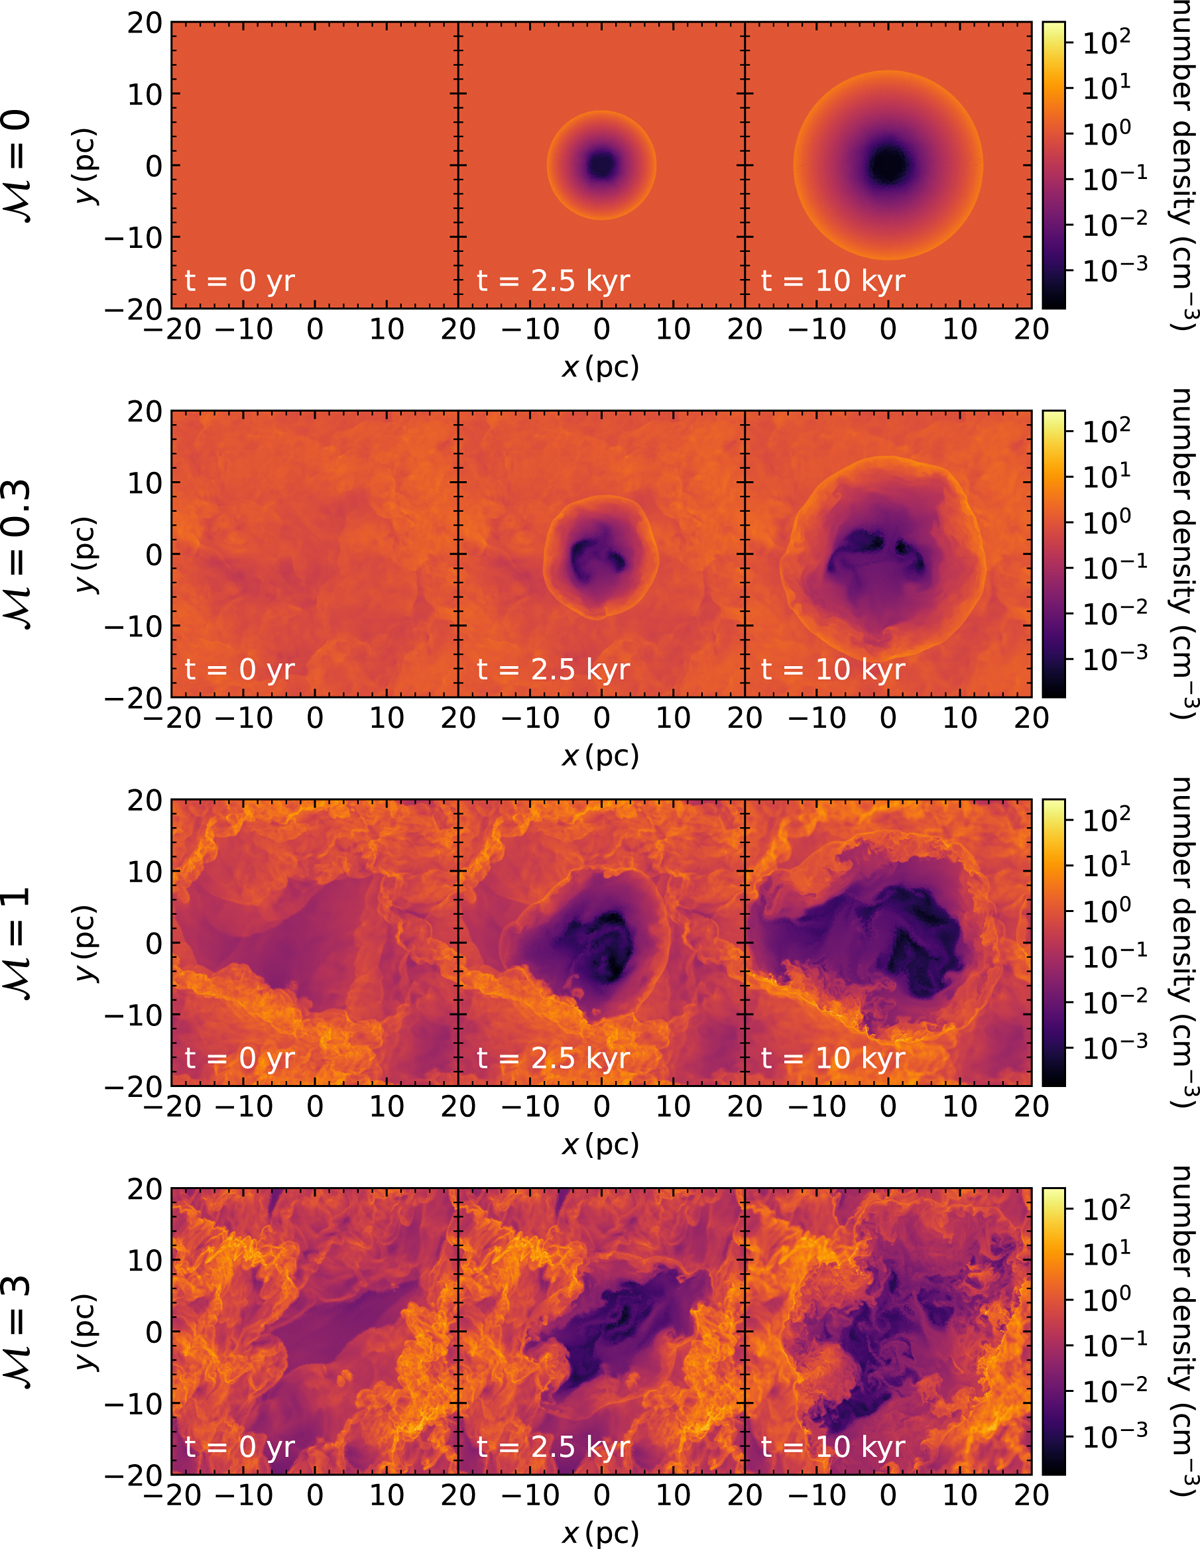
Number density of the z = 0 slice before SN injection (left), during the SNR evolution at 2.5 kyr (center), and at 10 kyr (right) for an average ISM density of n = 1 cm−3. The rows show the different Mach numbers of ℳ = 0, 0.3, 1, and 3 from top to bottom. The box size is always 40 pc in each direction. Movies of these simulations can be found online.
Current usage metrics show cumulative count of Article Views (full-text article views including HTML views, PDF and ePub downloads, according to the available data) and Abstracts Views on Vision4Press platform.
Data correspond to usage on the plateform after 2015. The current usage metrics is available 48-96 hours after online publication and is updated daily on week days.
Initial download of the metrics may take a while.