Open Access
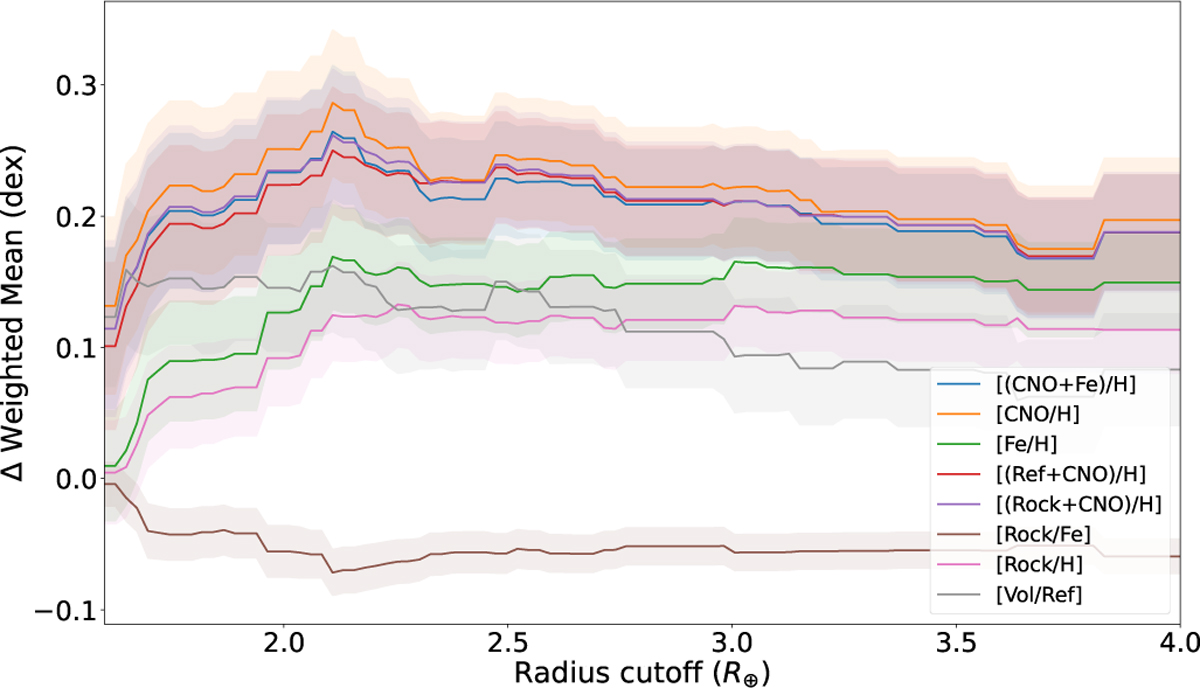
Fig. 4
Download original image
Weighted mean abundance differences (large minus small planet hosts) as a function of the chosen radius cutoff. Colored curves trace the various composite indices, with shaded bands showing uncertainties. The apparent volatile enhancement should be regarded as tentative given the limited reliability of C and N measurements.
Current usage metrics show cumulative count of Article Views (full-text article views including HTML views, PDF and ePub downloads, according to the available data) and Abstracts Views on Vision4Press platform.
Data correspond to usage on the plateform after 2015. The current usage metrics is available 48-96 hours after online publication and is updated daily on week days.
Initial download of the metrics may take a while.