Fig. 1.
Download original image
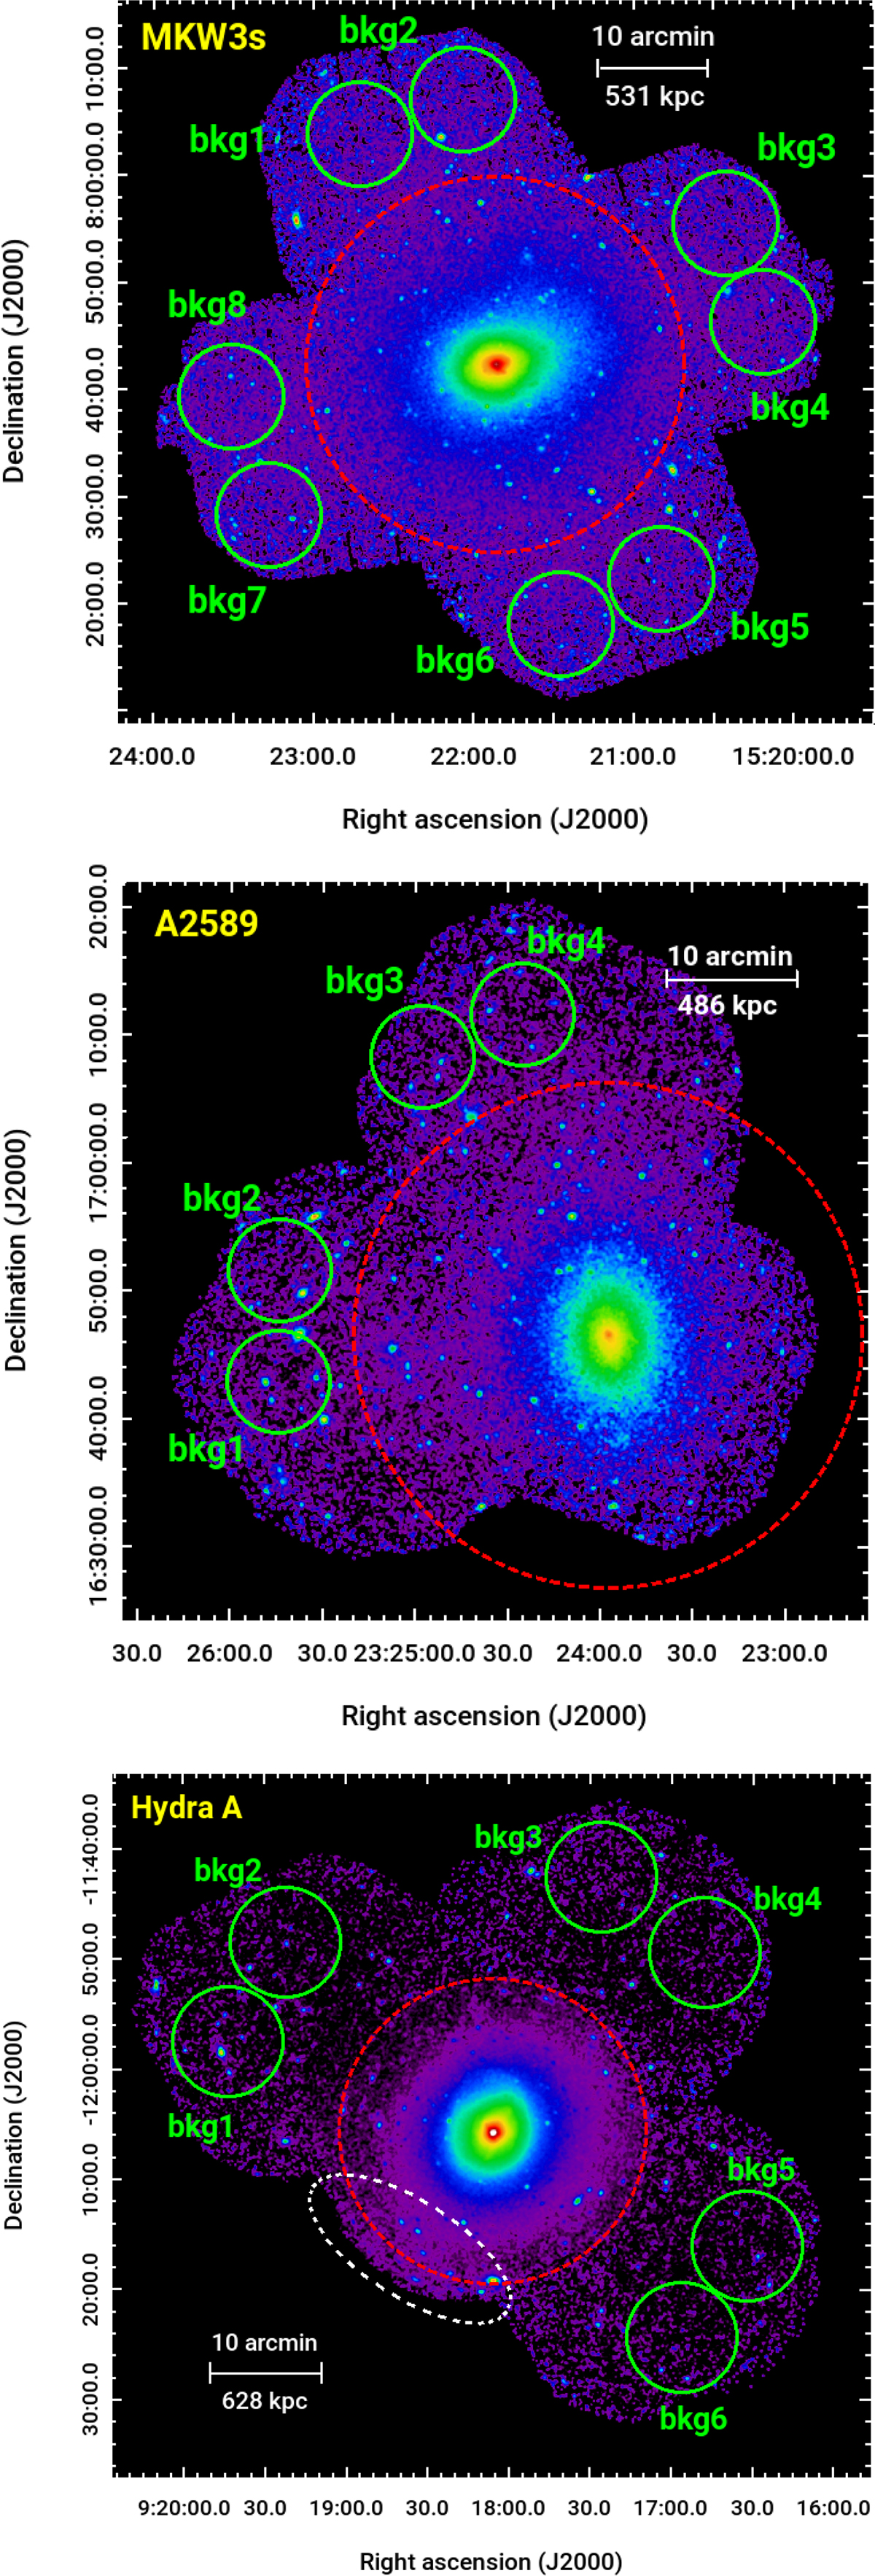
XMM-Newton/EPIC count-rate images of MKW3s (top), A2589 (centre), and Hydra A (bottom) in the 0.7 − 1.2 keV band. The red dashed circles mark R500 for each cluster. The green circles are the regions used to estimate the contamination from the X-ray sky background. The white dashed region in the bottom panel has been masked to remove residual thermal emission associated with LEDA 87445. A Gaussian filter has been used to smooth the images for visual purposes only.
Current usage metrics show cumulative count of Article Views (full-text article views including HTML views, PDF and ePub downloads, according to the available data) and Abstracts Views on Vision4Press platform.
Data correspond to usage on the plateform after 2015. The current usage metrics is available 48-96 hours after online publication and is updated daily on week days.
Initial download of the metrics may take a while.