Open Access
Fig. B.1.
Download original image
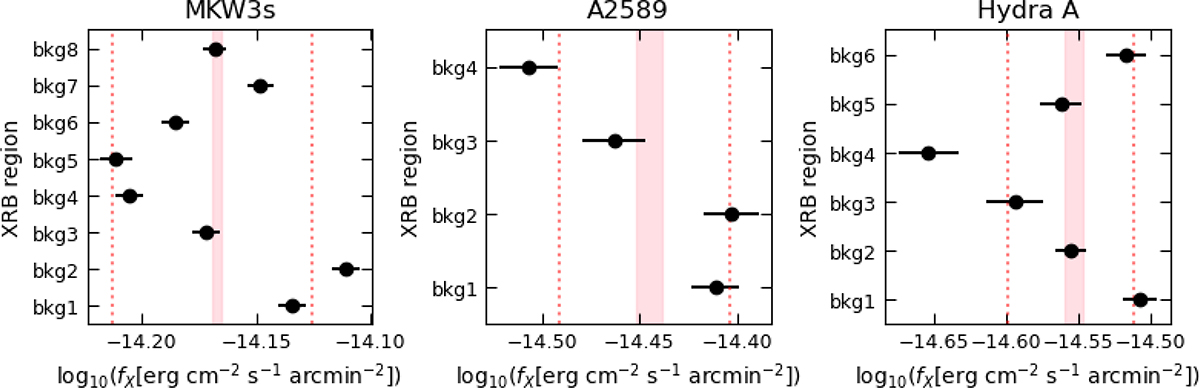
X-ray fluxes in the 0.5 − 2.0 keV energy band measured from individual background regions (green circles in Fig. 1). The shaded bands indicate the fluxes obtained from the joint fit of all background regions, with the dotted vertical lines marking a 10% variation from these values.
Current usage metrics show cumulative count of Article Views (full-text article views including HTML views, PDF and ePub downloads, according to the available data) and Abstracts Views on Vision4Press platform.
Data correspond to usage on the plateform after 2015. The current usage metrics is available 48-96 hours after online publication and is updated daily on week days.
Initial download of the metrics may take a while.