Fig. D.2.
Download original image
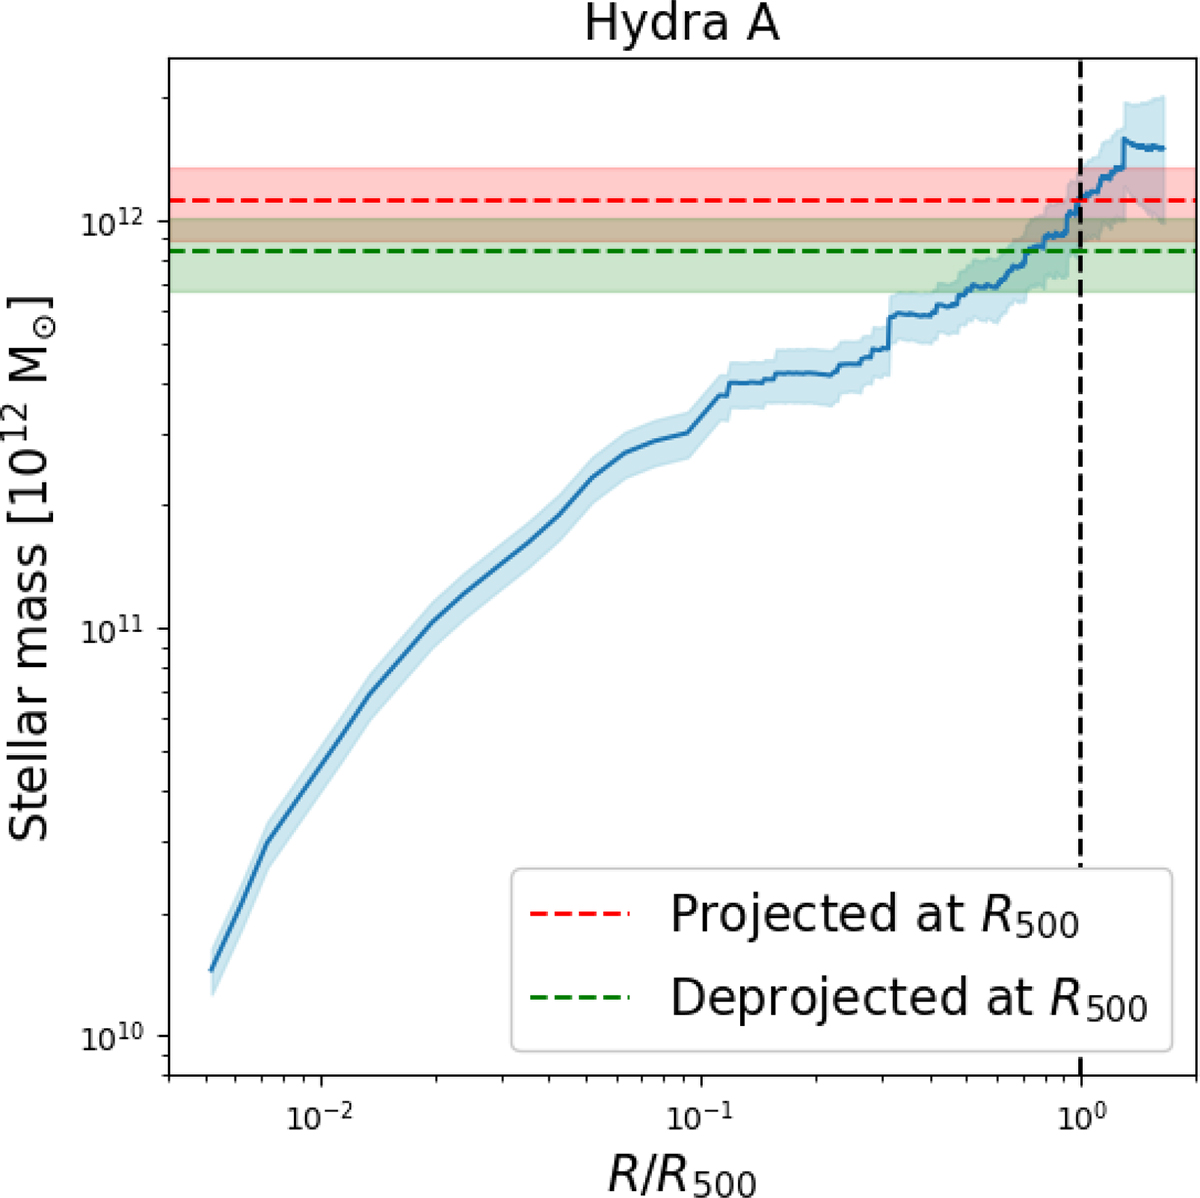
Cumulative projected stellar mass profile of Hydra A, produced within the X-COP framework following the methodology described in van der Burg et al. (2015). The dashed red line and shaded area indicate the best-fit value and associated uncertainty of the projected stellar mass at R500. The green line and shaded region represent the corresponding deprojected stellar mass within the same overdensity.
Current usage metrics show cumulative count of Article Views (full-text article views including HTML views, PDF and ePub downloads, according to the available data) and Abstracts Views on Vision4Press platform.
Data correspond to usage on the plateform after 2015. The current usage metrics is available 48-96 hours after online publication and is updated daily on week days.
Initial download of the metrics may take a while.