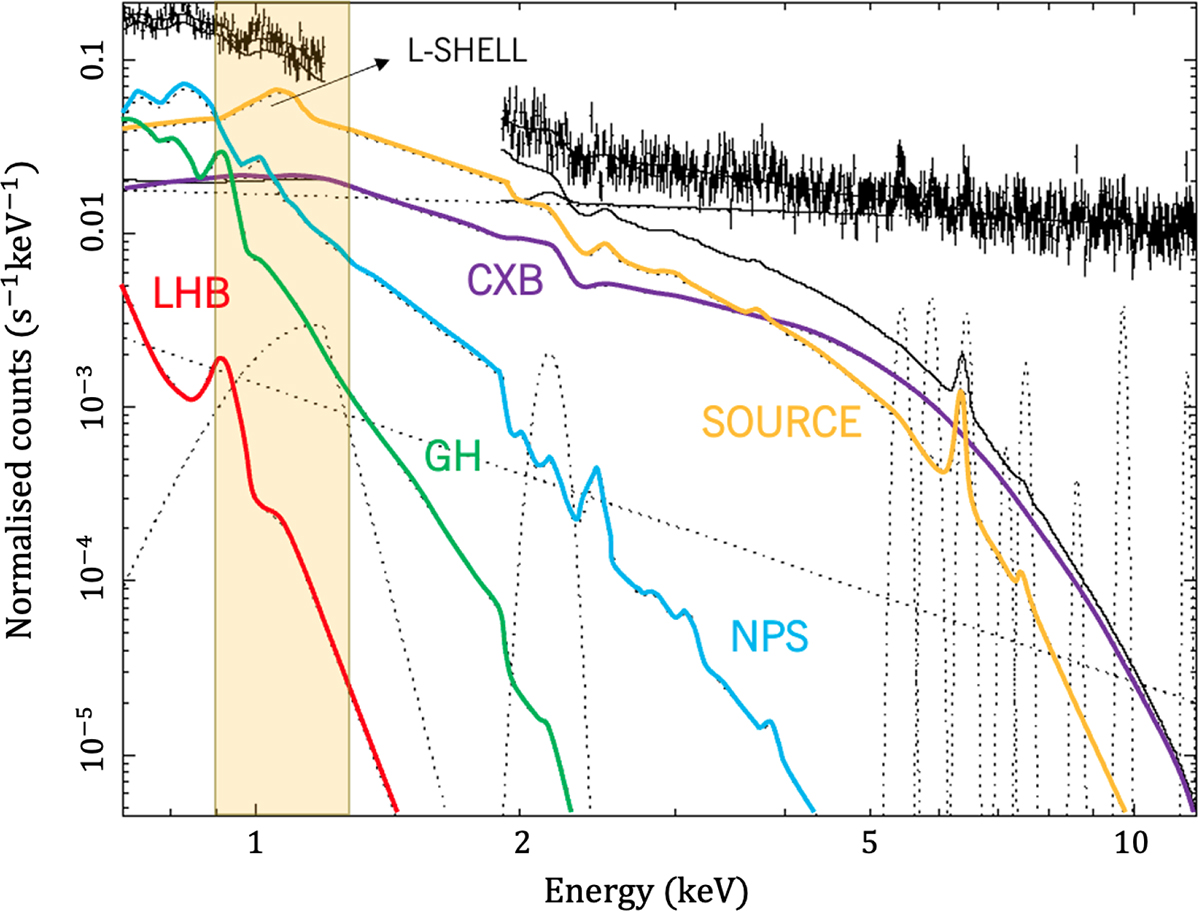
Fig. 2.
Download original image
Relative contribution between source emission and background components in the outskirts of MKW3s. Black data are the XMM-Newton/MOS 2 spectrum, extracted from the ring with r = 10′−12′ (i.e. 0.57 − 0.68 R500). Yellow is used to highlight the best-fitting model for the source emission; the Fe L-shell blend is visible at ∼1 keV. Red, green, light blue, and purple are used to mark the LHB, the GH, the NPS, and the CXB, estimated from the region named bkg1. Dotted lines are the model adopted to describe the particle-induced background, which includes power laws and Gaussian lines. The solid black lines show the resulting model for the X-ray sky components (i.e. the source plus the XRB) and the particle-induced background.
Current usage metrics show cumulative count of Article Views (full-text article views including HTML views, PDF and ePub downloads, according to the available data) and Abstracts Views on Vision4Press platform.
Data correspond to usage on the plateform after 2015. The current usage metrics is available 48-96 hours after online publication and is updated daily on week days.
Initial download of the metrics may take a while.