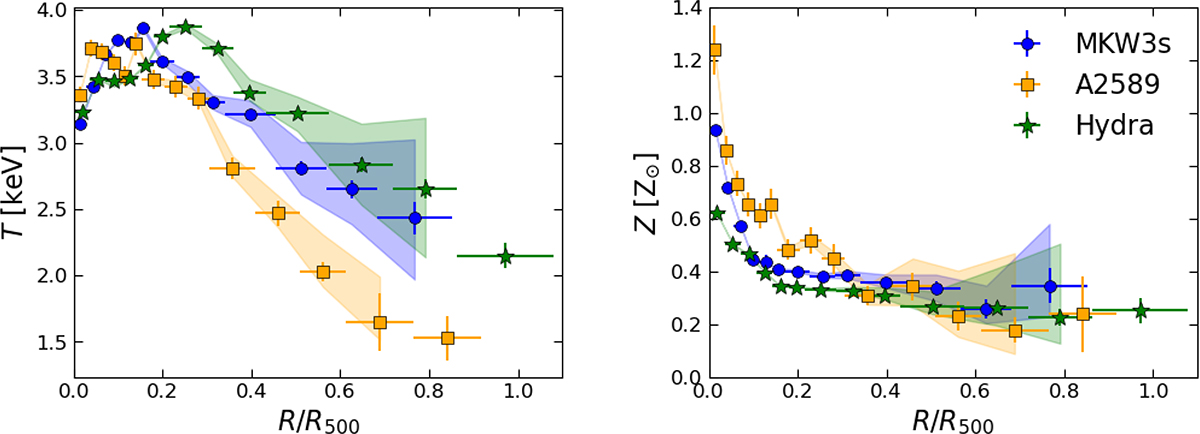
Fig. 3.
Download original image
Temperature (left) and iron abundance (right) profiles for MKW3s, A2589, and Hydra A. Blue dots, orange squares, and green stars represent measurements obtained with azimuthally averaged XRB parameters. The effect of modelling the XRB contamination from individual regions is shown by the shaded areas, which capture the maximum dispersion of the measured profiles shown in Fig. A.4. As mentioned in the text, the measurements derived from individual XRB modelling for both A2589 and Hydra A do not extend to the outermost radial bins due to the very low source signal which makes them difficult to constrain.
Current usage metrics show cumulative count of Article Views (full-text article views including HTML views, PDF and ePub downloads, according to the available data) and Abstracts Views on Vision4Press platform.
Data correspond to usage on the plateform after 2015. The current usage metrics is available 48-96 hours after online publication and is updated daily on week days.
Initial download of the metrics may take a while.