Fig. 4.
Download original image
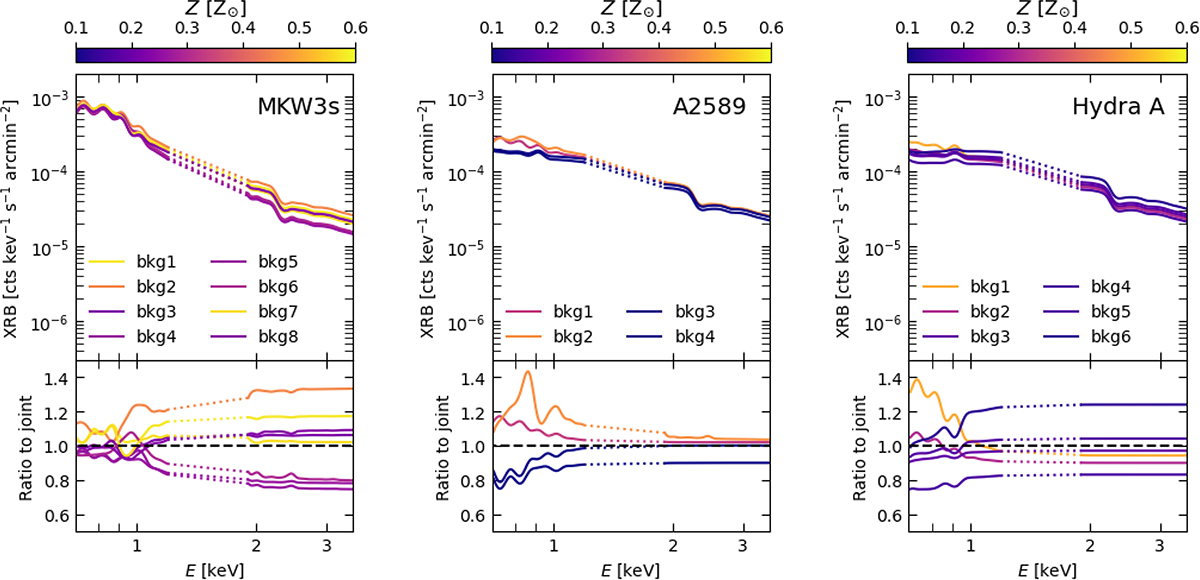
Soft X-ray background models (top panels) obtained from individual offset regions around each cluster (see Fig. 1) and ratio (bottom panels) of each individual XRB model to the azimuthally averaged model for each cluster. From left to right: MKW3s, A2589, and Hydra A. Each model results from the combination of the parameters shown in Figs. A.1, A.2, and A.3 and is colour-coded according to the metal abundance derived in the outermost bin for each cluster using that particular parameterisation. Models between 1.2 and 1.9 keV are indicated with dotted lines, as this energy range was excluded from the fitting procedure.
Current usage metrics show cumulative count of Article Views (full-text article views including HTML views, PDF and ePub downloads, according to the available data) and Abstracts Views on Vision4Press platform.
Data correspond to usage on the plateform after 2015. The current usage metrics is available 48-96 hours after online publication and is updated daily on week days.
Initial download of the metrics may take a while.