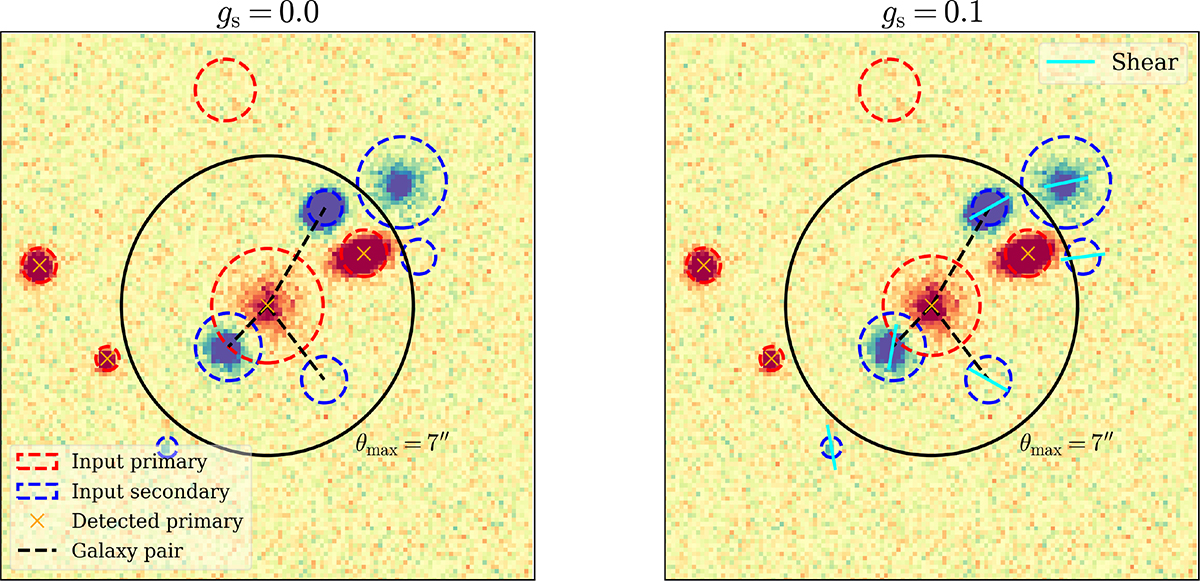
Fig. 1.
Download original image
Illustration of the half-sheared simulation used to capture the blending shear response. Input secondary galaxies are marked with dashed blue circles, and input primary galaxies with red ones. A subset of the primary galaxies is associated with detections as described in Sect. 3.2, indicated by orange crosses. Two sets of simulations share the same galaxy catalogue and noise realisation, but differ in the shear applied to secondary galaxies: gs = 0.0 (left panel) and gs = 0.1 in uncorrelated directions (right panel). Galaxy pairs are identified by finding each secondary galaxy within 10 arcsec of a primary detection found in both simulations. For each pair, the change in the measured shape of the primary galaxy’s detection along the shear direction is calculated between the two simulations, which is used to estimate ![]() .
.
Current usage metrics show cumulative count of Article Views (full-text article views including HTML views, PDF and ePub downloads, according to the available data) and Abstracts Views on Vision4Press platform.
Data correspond to usage on the plateform after 2015. The current usage metrics is available 48-96 hours after online publication and is updated daily on week days.
Initial download of the metrics may take a while.