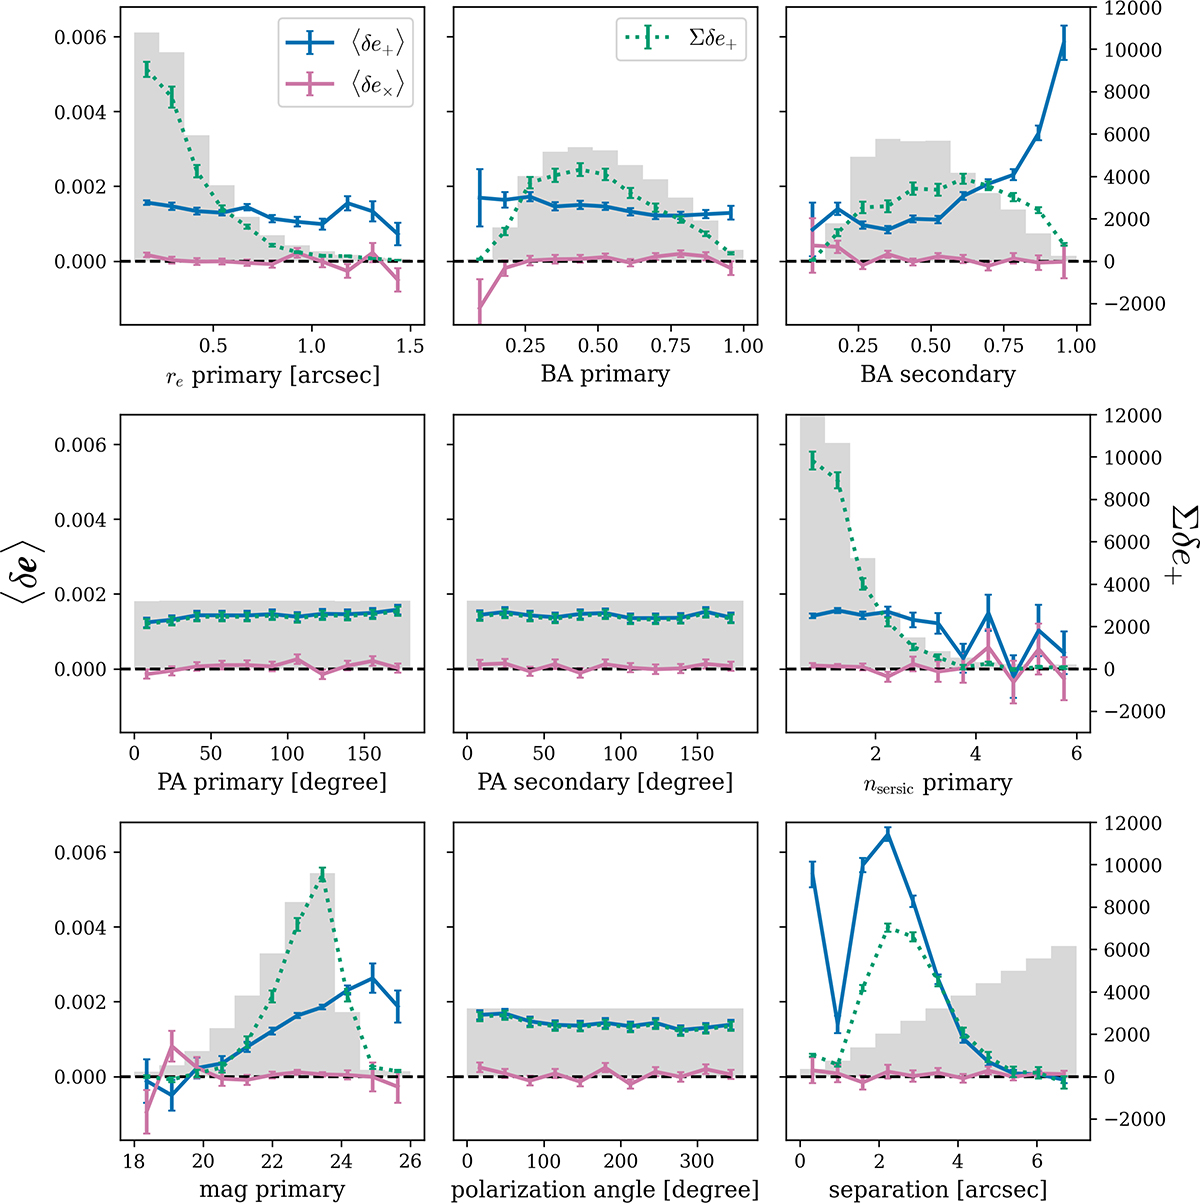
Fig. 2.
Download original image
Binned average of ⟨δe⟩ versus some of the properties of each blend, including effective radius (re), axis ratio (BA), position angle (PA), Sersic index (nsersic), magnitude (mag), the polarisation angle between the pair, and their separation on the sky. Dependence on properties that closely correlate with the secondary galaxy’s brightness is shown in Fig. 3. The blue curves show the component, ⟨δe+⟩, projected in the direction of the shear applied to the secondary, while the pink ones are in the direction 45 degrees to the shear, ⟨δe×⟩. Normalised histograms of each property are plotted as filled histograms. The population-weighted Σδe+ are shown as green curves.
Current usage metrics show cumulative count of Article Views (full-text article views including HTML views, PDF and ePub downloads, according to the available data) and Abstracts Views on Vision4Press platform.
Data correspond to usage on the plateform after 2015. The current usage metrics is available 48-96 hours after online publication and is updated daily on week days.
Initial download of the metrics may take a while.