Fig. 4.
Download original image
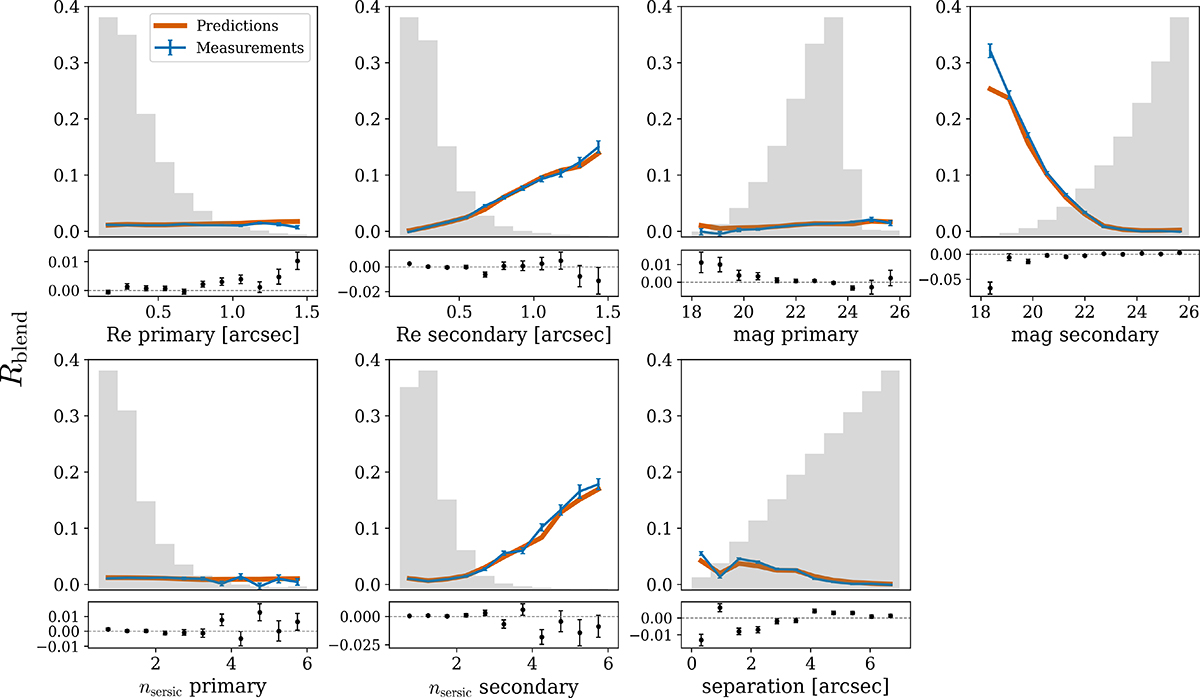
Binned average of blending response versus galaxy properties used in training the emulator. Blue curves with errors are measurements, while red curves are the predictions. Mini panels present the residuals between predictions and measurements with a varying y-axis scale. Normalised histograms of each property are plotted in grey histograms.
Current usage metrics show cumulative count of Article Views (full-text article views including HTML views, PDF and ePub downloads, according to the available data) and Abstracts Views on Vision4Press platform.
Data correspond to usage on the plateform after 2015. The current usage metrics is available 48-96 hours after online publication and is updated daily on week days.
Initial download of the metrics may take a while.