Fig. 7.
Download original image
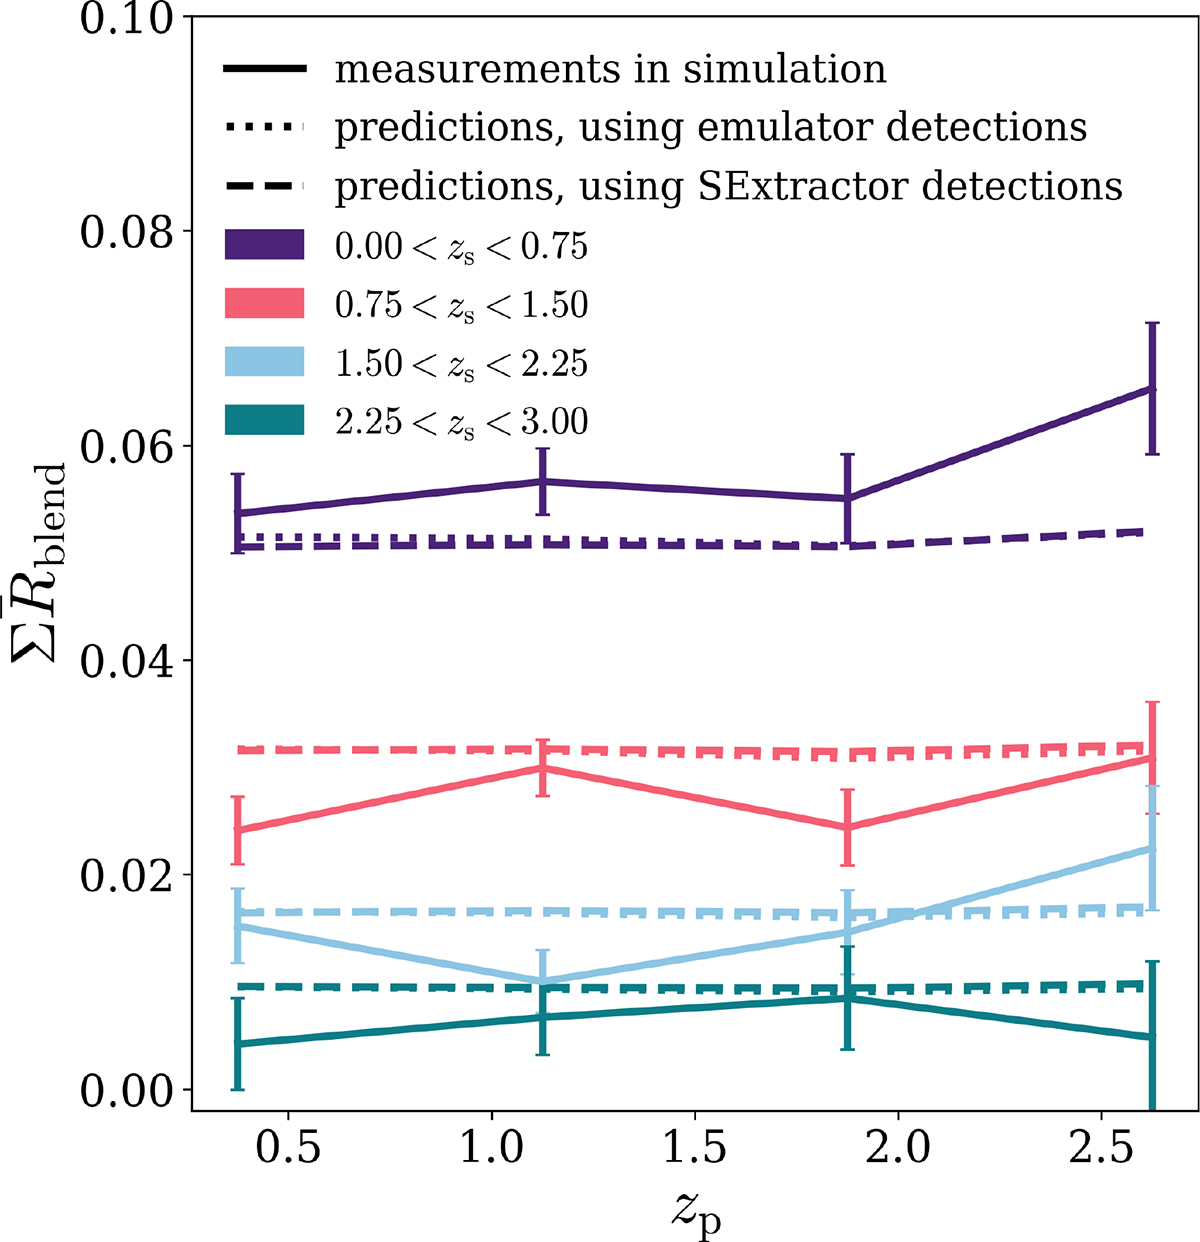
Averaged response of galaxy pairs as a function of the redshift, z, of the primary galaxy and the redshift, z′, of the secondary galaxy. With the measurements depicted in solid lines, the dotted ones present the results in which the responses are predictions from the emulator on the SEXTRACTOR catalogue, while the dashed lines use the emulator detections.
Current usage metrics show cumulative count of Article Views (full-text article views including HTML views, PDF and ePub downloads, according to the available data) and Abstracts Views on Vision4Press platform.
Data correspond to usage on the plateform after 2015. The current usage metrics is available 48-96 hours after online publication and is updated daily on week days.
Initial download of the metrics may take a while.