Fig. 8.
Download original image
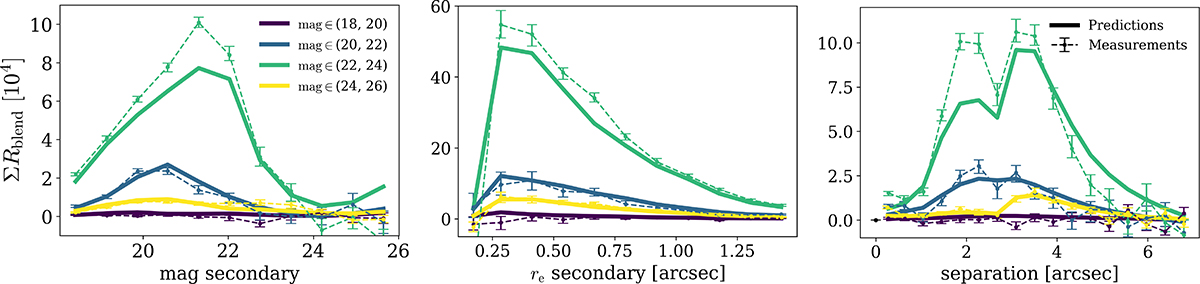
Emulator-predicted blending response summed over population (solid lines), in several sections with respect to the magnitude of the detected objects, as well as the magnitude, effective radius, and separation of their neighbouring galaxies. The points with error connected with dashed lines present the direct measurements from simulation.
Current usage metrics show cumulative count of Article Views (full-text article views including HTML views, PDF and ePub downloads, according to the available data) and Abstracts Views on Vision4Press platform.
Data correspond to usage on the plateform after 2015. The current usage metrics is available 48-96 hours after online publication and is updated daily on week days.
Initial download of the metrics may take a while.