Fig. 11.
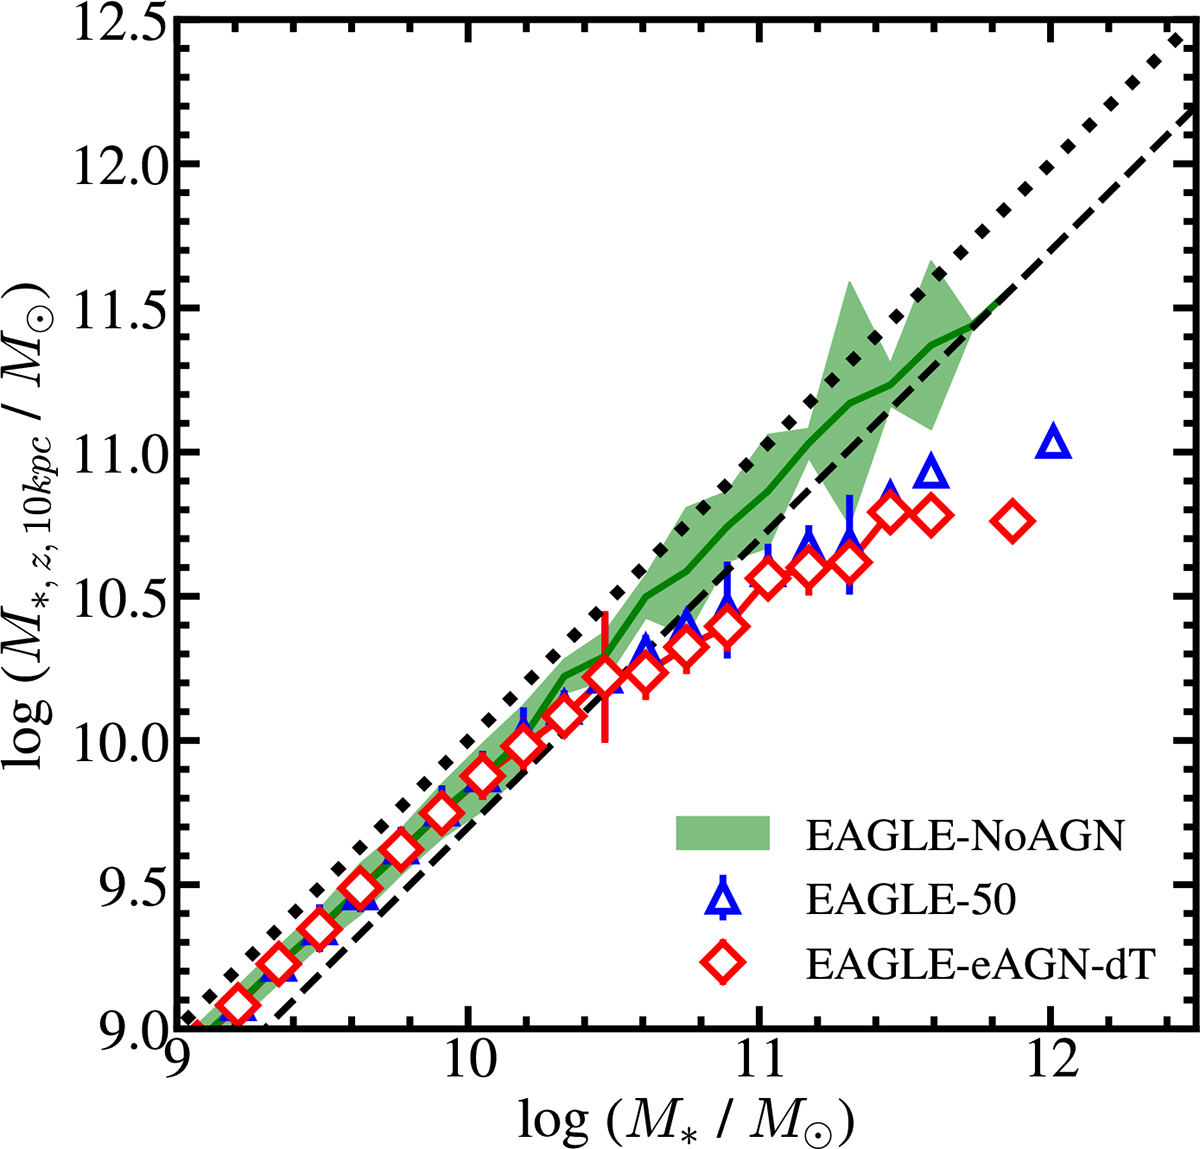
Download original image
Median stellar mass measured within cylindrical volume with 10 kpc aperture as function of total stellar mass of pressure-dominated galaxies in various EAGLE simulations. Symbols are the same as in Figure 10. The dashed line indicates the relations between total stellar mass and the stellar mass within half-mass radius. The dotted line indicates the one-to-one correspondence between the two stellar masses. The error bar and shaded region indicate the 1σ standard deviation of the galaxies in each stellar mass bin.
Current usage metrics show cumulative count of Article Views (full-text article views including HTML views, PDF and ePub downloads, according to the available data) and Abstracts Views on Vision4Press platform.
Data correspond to usage on the plateform after 2015. The current usage metrics is available 48-96 hours after online publication and is updated daily on week days.
Initial download of the metrics may take a while.