Fig. 2.
Download original image
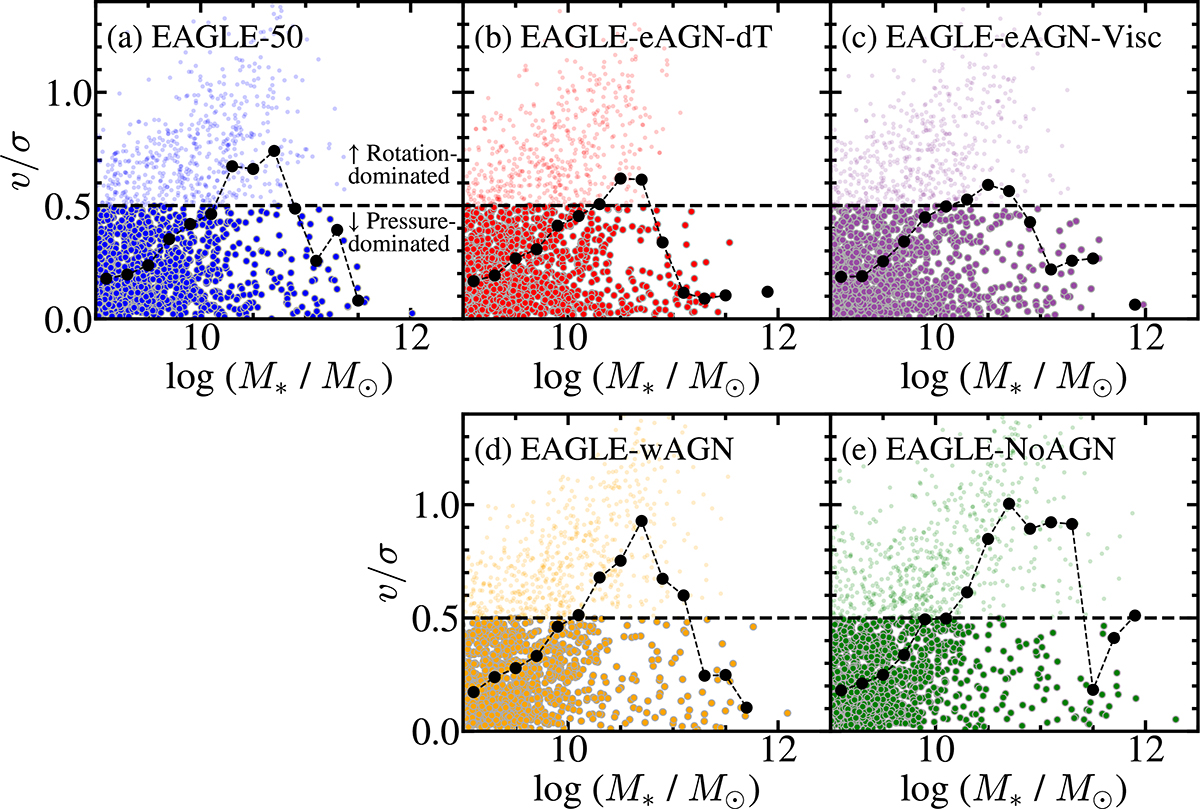
v/σ ratio as function of stellar mass for subhalos in (a) EAGLE-50, (b) EAGLE-eAGN-dT, (c) EAGLE-eAGN-Visc, (d) EAGLE-wAGN, and (e) EAGLE-NoAGN. Black circles display the median v/σ as a function of stellar mass for subhalos in each simulation. Horizontal dashed lines indicate v/σ = 0.5, where the rotation-dominated (v/σ ≥ 0.5) and pressure-dominated (v/σ < 0.5) galaxies are separated.
Current usage metrics show cumulative count of Article Views (full-text article views including HTML views, PDF and ePub downloads, according to the available data) and Abstracts Views on Vision4Press platform.
Data correspond to usage on the plateform after 2015. The current usage metrics is available 48-96 hours after online publication and is updated daily on week days.
Initial download of the metrics may take a while.