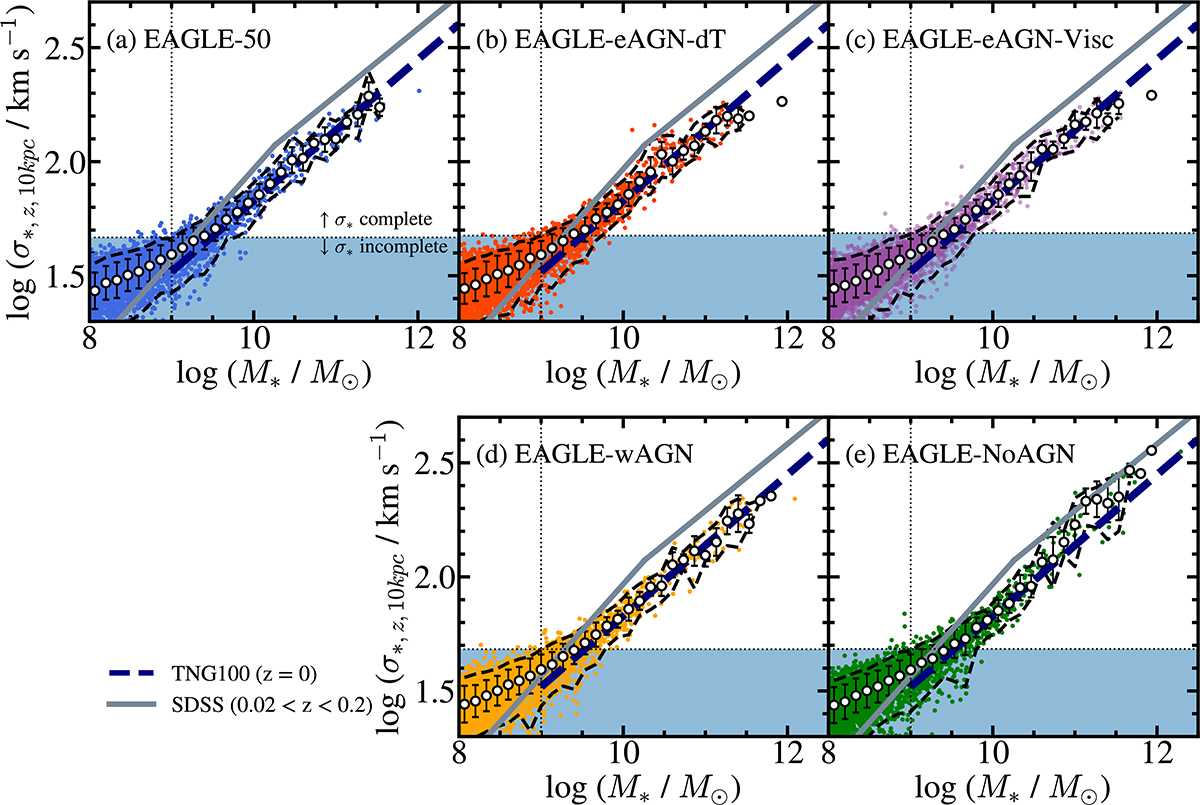
Fig. 4.
Download original image
Stellar mass to 1D stellar velocity dispersion measured within a cylindrical volume with a 10 kpc aperture along with z-axis (σ*, z, 10 kpc) relations of galaxy subhalos in (a) EAGLE-50, (b) EAGLE-eAGN-dT, (c) EAGLE-eAGN-Visc, (d) EAGLE-wAGN, and (e) EAGLE-NoAGN. White circles show the median σ*, z, 10 kpc at each stellar mass bin. Bold, dashed black lines show the central 95% of the σ*, z, 10 kpc distributions. Vertical dotted lines indicate the stellar mass limit we applied. Horizontal dotted lines mark the velocity dispersion limit where the stellar mass limit intersects with the 95% upper limit of the velocity dispersion distributions. Below this velocity dispersion limit, our EAGLE galaxy samples are incomplete in terms of velocity dispersion. The subhalos in the shaded region are excluded from the σ* complete sample. The dashed blue lines indicate the M* − σ* relation for TNG100 (Sohn et al. 2024a), and the solid gray lines show the observed M* − σ* relation for SDSS quiescent subhalos in the local Universe (Zahid et al. 2016).
Current usage metrics show cumulative count of Article Views (full-text article views including HTML views, PDF and ePub downloads, according to the available data) and Abstracts Views on Vision4Press platform.
Data correspond to usage on the plateform after 2015. The current usage metrics is available 48-96 hours after online publication and is updated daily on week days.
Initial download of the metrics may take a while.