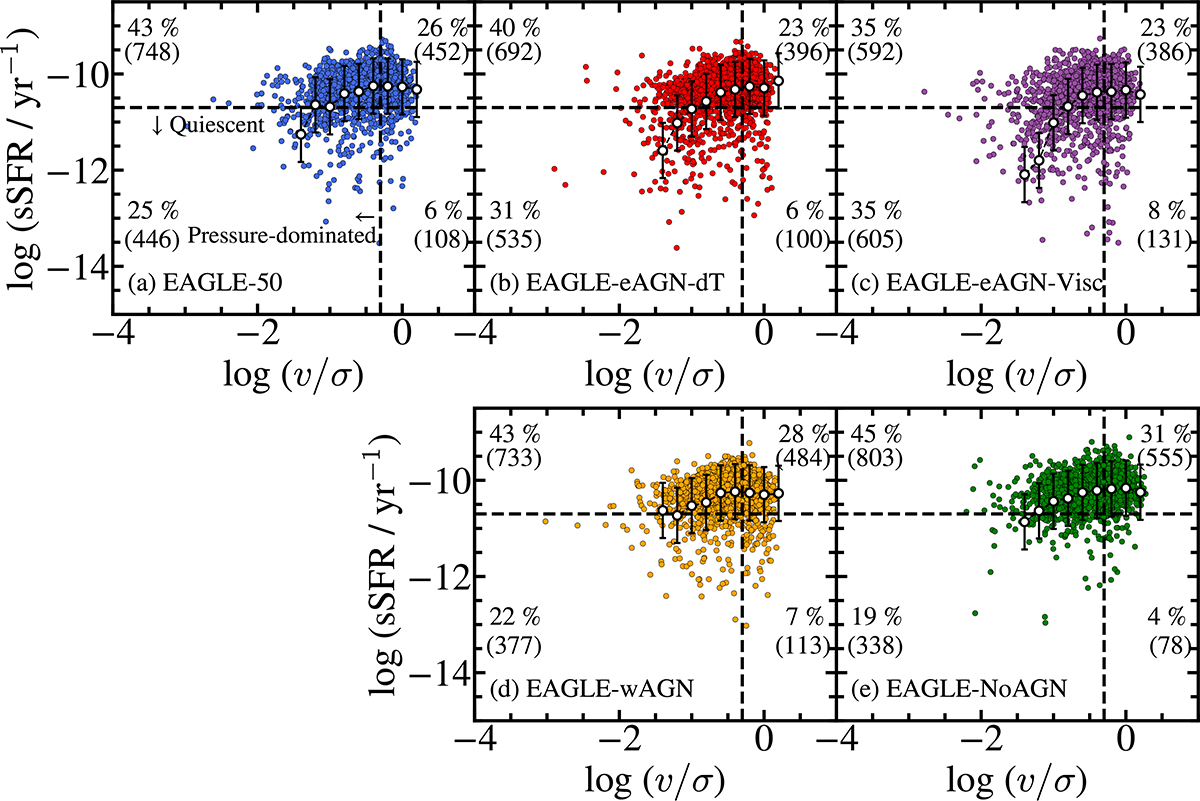
Fig. 7.
Download original image
Specific star formation rate as a function of v/σ for all subhalos in five EAGLE simulations. Vertical lines show the selection boundary between pressure-dominated and rotation-dominated galaxies (i.e., v/σ = 0.5). Horizontal lines show another boundary that separates quiescent and star-forming galaxies (i.e., sSFR = 2 × 10⁻¹¹ yr−1). The numbers indicate the fraction of galaxies in each area among the entire sample with log(M*/M⊙) > 9. White circles show the median sSFR at each v/σ bin. The error bar indicates the 1σ standard deviation of the galaxies in each v/σ bin.
Current usage metrics show cumulative count of Article Views (full-text article views including HTML views, PDF and ePub downloads, according to the available data) and Abstracts Views on Vision4Press platform.
Data correspond to usage on the plateform after 2015. The current usage metrics is available 48-96 hours after online publication and is updated daily on week days.
Initial download of the metrics may take a while.