Open Access
Fig. 8.
Download original image
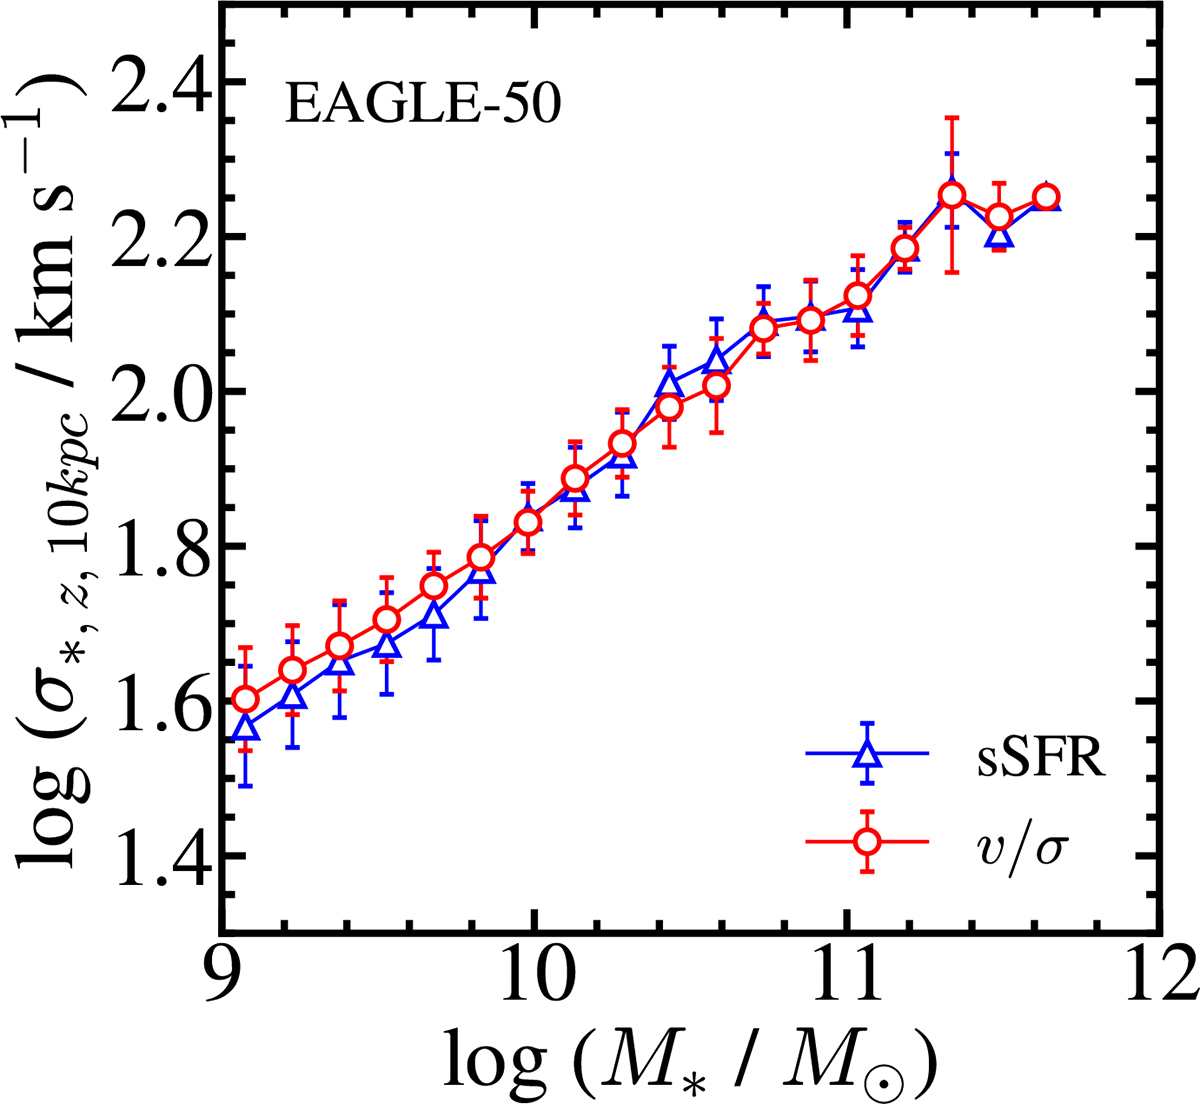
Median M* − σ* relation for EAGLE-50. Red circles and blue triangles show the relations derived from pressure-dominated galaxies with v/σ < 0.5 and the quiescent galaxies with sSFR < 2 × 10⁻¹¹ yr−1, respectively. The error bars indicate the 1σ standard deviations.
Current usage metrics show cumulative count of Article Views (full-text article views including HTML views, PDF and ePub downloads, according to the available data) and Abstracts Views on Vision4Press platform.
Data correspond to usage on the plateform after 2015. The current usage metrics is available 48-96 hours after online publication and is updated daily on week days.
Initial download of the metrics may take a while.