Fig. A.3.
Download original image
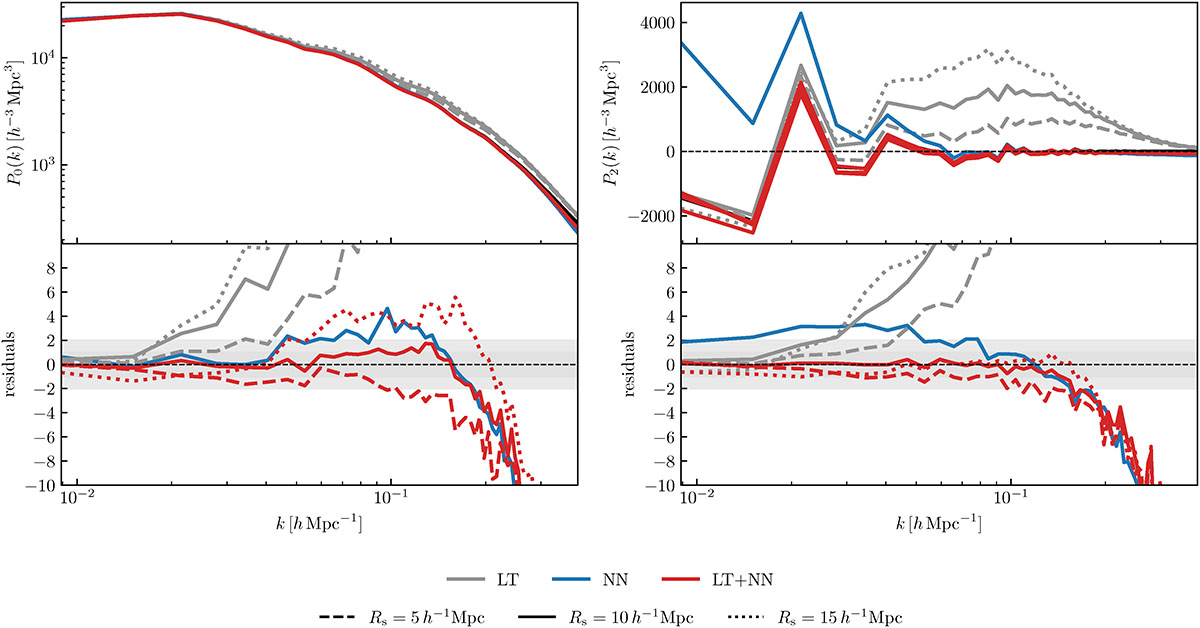
Measurements and residuals of the monopole (left) and quadrupole (right) moments of the power spectrum of the true and reconstructed halo number density fields, computed on 1283 grids and averaged over the 20 validation fields. The same color code is used consistently across all figures. Solid curves (see Fig. 5) correspond to the reference case with Rs = 10 h−1 Mpc Gaussian smoothing. Dashed and dotted curves represent reconstructions performed with Rs = 5 h−1 Mpc and Rs = 15 h−1 Mpc, respectively.
Current usage metrics show cumulative count of Article Views (full-text article views including HTML views, PDF and ePub downloads, according to the available data) and Abstracts Views on Vision4Press platform.
Data correspond to usage on the plateform after 2015. The current usage metrics is available 48-96 hours after online publication and is updated daily on week days.
Initial download of the metrics may take a while.