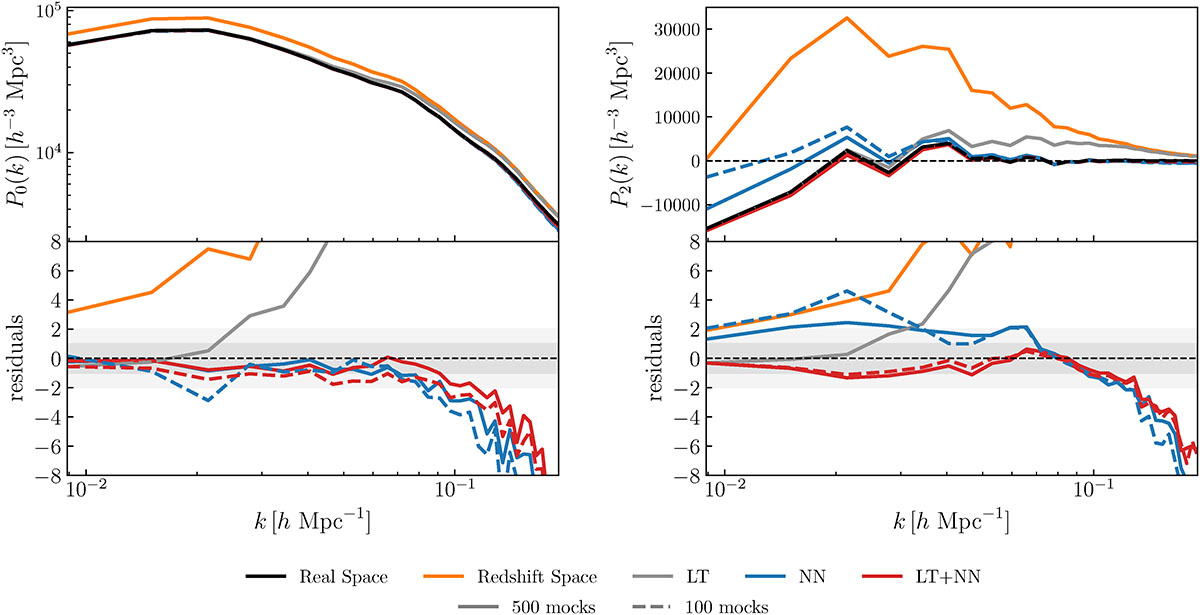
Fig. B.1.
Download original image
Measurements and residuals of the monopole (left) and quadrupole (right) moments of the power spectrum for the true and reconstructed halo number density fields from the Fiducial QUIJOTE simulations. Results are computed on 643 grids and averaged over the 20 test fields (mocks 500–519). The color scheme is consistent across all figures and described in the legend. Dashed curves correspond to training on mocks 0–79 with mocks 80–99 used for validation, while solid curves correspond to training on mocks 0–399 with mocks 400–499 used for validation.
Current usage metrics show cumulative count of Article Views (full-text article views including HTML views, PDF and ePub downloads, according to the available data) and Abstracts Views on Vision4Press platform.
Data correspond to usage on the plateform after 2015. The current usage metrics is available 48-96 hours after online publication and is updated daily on week days.
Initial download of the metrics may take a while.