Open Access
Fig. 2.
Download original image
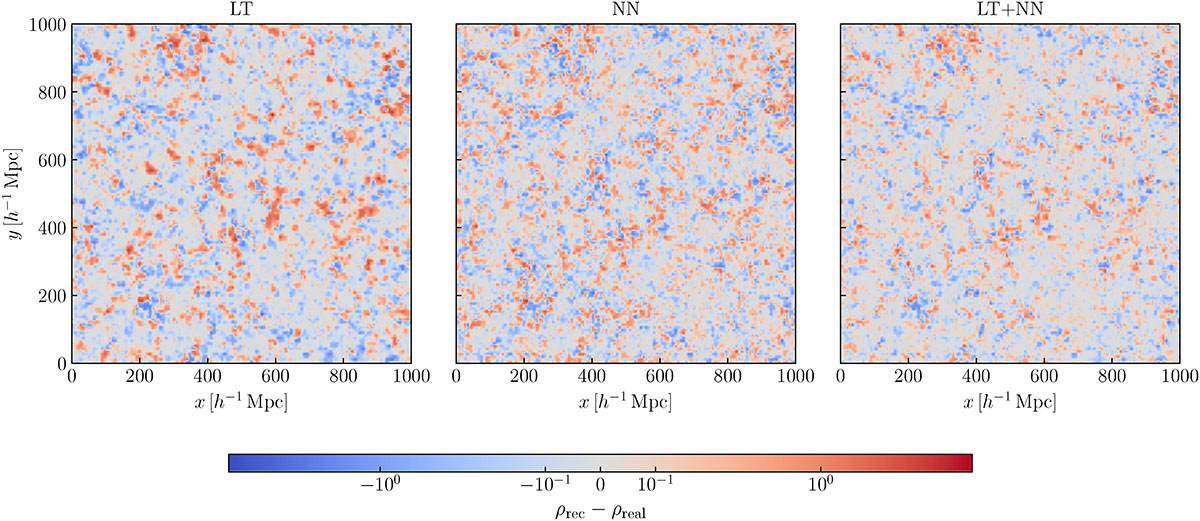
Residuals between the density field obtained with the three reconstruction methods, identified by the top labels, and the real space density field. The plots show the density in a slice of 7.8 h−1 Mpc from one of the validation set, extracted across the z axis of the cube and expressed in number of halos per cell.
Current usage metrics show cumulative count of Article Views (full-text article views including HTML views, PDF and ePub downloads, according to the available data) and Abstracts Views on Vision4Press platform.
Data correspond to usage on the plateform after 2015. The current usage metrics is available 48-96 hours after online publication and is updated daily on week days.
Initial download of the metrics may take a while.