Open Access
Fig. 3.
Download original image
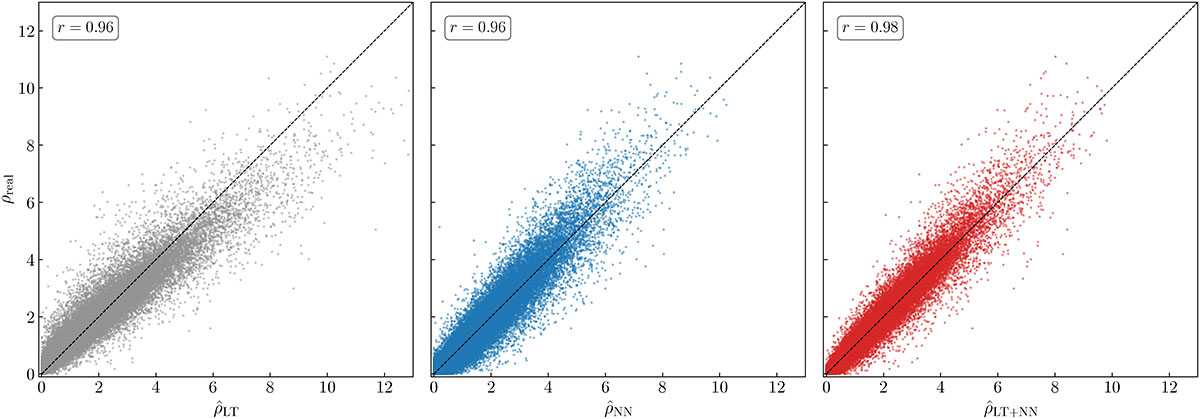
Scatter plot of the true vs. the reconstructed halo number density – in units of halos per cell – measured at the points of the 1283 grid for the three reconstruction methods considered: LT (left), NN (middle) and LT + NN (right). The plot was made by sampling points from the 20 fields of the validation set.
Current usage metrics show cumulative count of Article Views (full-text article views including HTML views, PDF and ePub downloads, according to the available data) and Abstracts Views on Vision4Press platform.
Data correspond to usage on the plateform after 2015. The current usage metrics is available 48-96 hours after online publication and is updated daily on week days.
Initial download of the metrics may take a while.