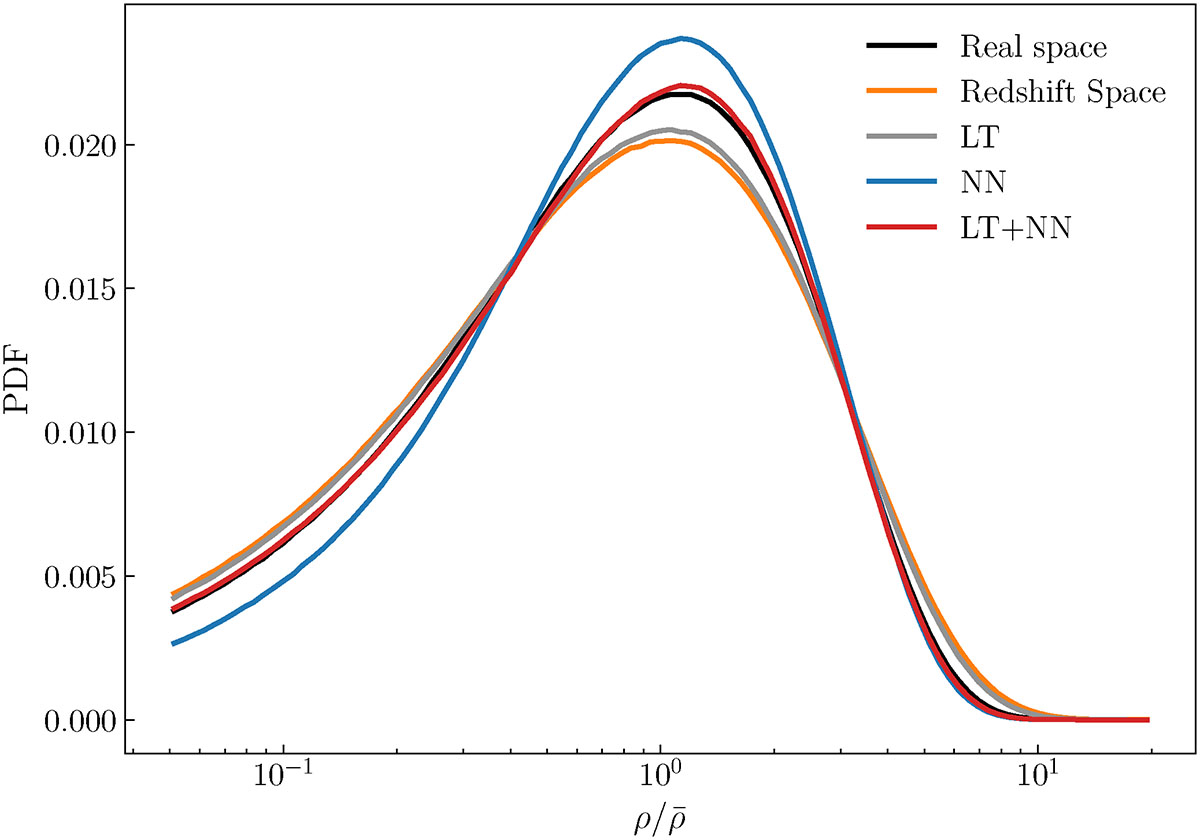
Fig. 4.
Download original image
Probability distribution functions (PDFs) of the reconstructed density fields, normalized by the mean, for the three methods (LT, NN, and LT + NN) are shown alongside the true distribution and labeled accordingly. The plot shows the average over 20 validation samples and displays the PDFs in lin-log scales, to better highlight discrepancies.
Current usage metrics show cumulative count of Article Views (full-text article views including HTML views, PDF and ePub downloads, according to the available data) and Abstracts Views on Vision4Press platform.
Data correspond to usage on the plateform after 2015. The current usage metrics is available 48-96 hours after online publication and is updated daily on week days.
Initial download of the metrics may take a while.