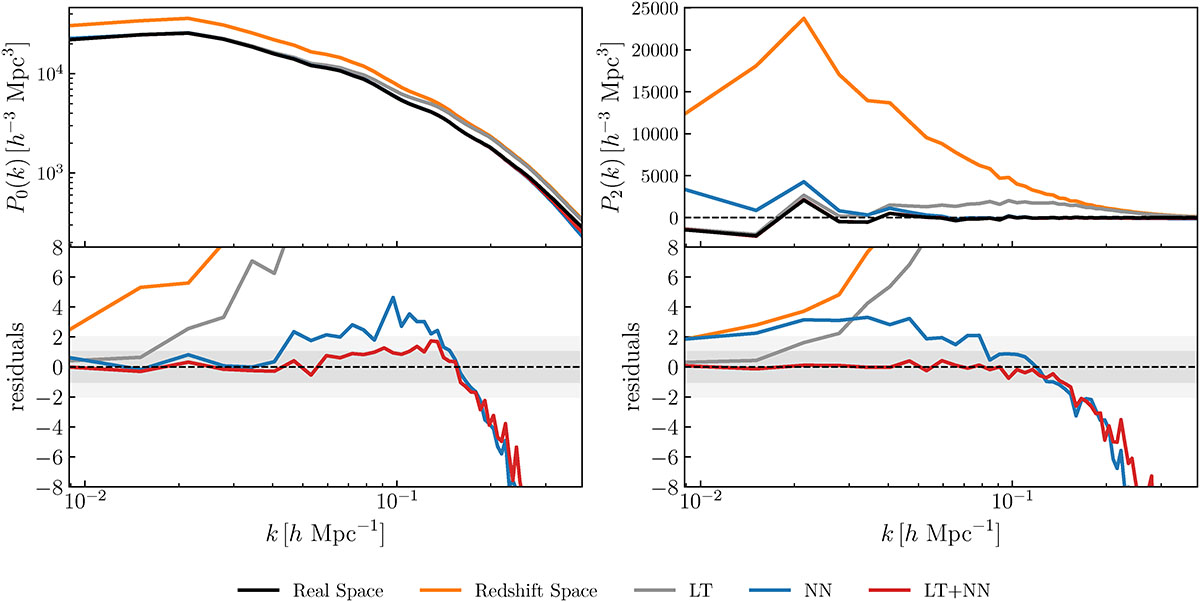
Fig. 5.
Download original image
Monopole and quadrupole moments of the power spectrum of the true and reconstructed halo number density fields, computed on 1283 grids. In all cases, we show the average over the 20 validation fields. Different colors indicate different types of reconstructions, as specified in the figure legend. The left (right) panels display the monopole (quadrupole) moments in the top panels, and the corresponding residuals with respect to the reference (true) fields are in the bottom panels. The grey bands in the bottom panels represent the 1σ and 2σ uncertainty regions, estimated from the scatter among the 20 realizations. LT and LT + NN reconstructions were performed using a Gaussian filter of radius Rs = 10 h−1 Mpc.
Current usage metrics show cumulative count of Article Views (full-text article views including HTML views, PDF and ePub downloads, according to the available data) and Abstracts Views on Vision4Press platform.
Data correspond to usage on the plateform after 2015. The current usage metrics is available 48-96 hours after online publication and is updated daily on week days.
Initial download of the metrics may take a while.