Open Access
Fig. 7.
Download original image
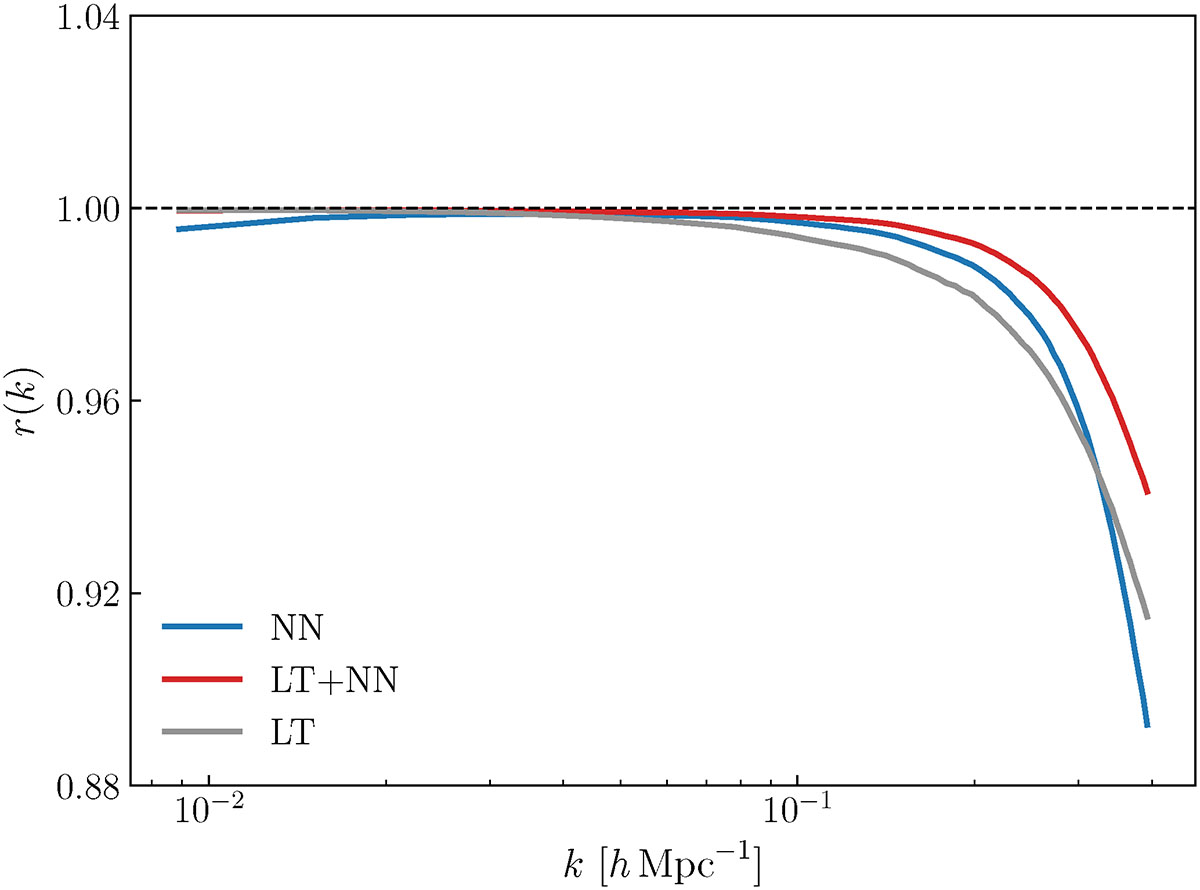
Cross-correlation coefficient as a function of wavenumber between the reconstructed and true halo density power spectra. The curves represent averages over 20 realizations computed on a 1283 grid. Different colors indicate the reconstruction methods, as specified in the labels.
Current usage metrics show cumulative count of Article Views (full-text article views including HTML views, PDF and ePub downloads, according to the available data) and Abstracts Views on Vision4Press platform.
Data correspond to usage on the plateform after 2015. The current usage metrics is available 48-96 hours after online publication and is updated daily on week days.
Initial download of the metrics may take a while.