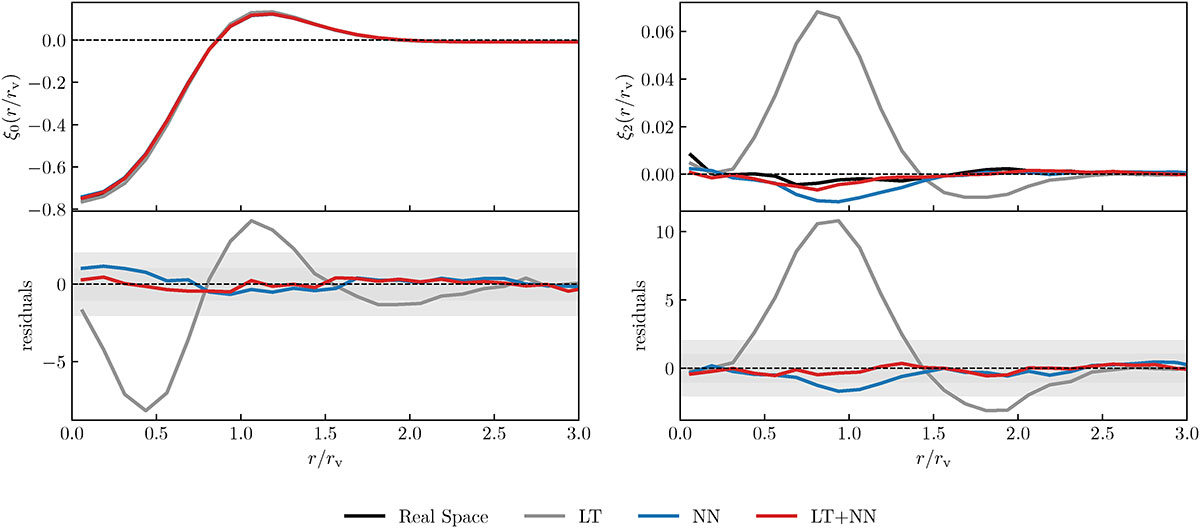
Fig. 8.
Download original image
Monopole (left panels) and quadrupole (right panels) moments of the void-halo cross correlation function, averaged over the 20 reconstructions in the validation set. Curves in different colors correspond to the various reconstruction methods, as indicated in the figure. The top panels show the measured multipoles, while the bottom panels display their residuals with respect to the reference case. Grey shaded bands indicate the 1σ and 2σ uncertainty regions, estimated from the scatter among the 20 realizations.
Current usage metrics show cumulative count of Article Views (full-text article views including HTML views, PDF and ePub downloads, according to the available data) and Abstracts Views on Vision4Press platform.
Data correspond to usage on the plateform after 2015. The current usage metrics is available 48-96 hours after online publication and is updated daily on week days.
Initial download of the metrics may take a while.