Fig. 1.
Download original image
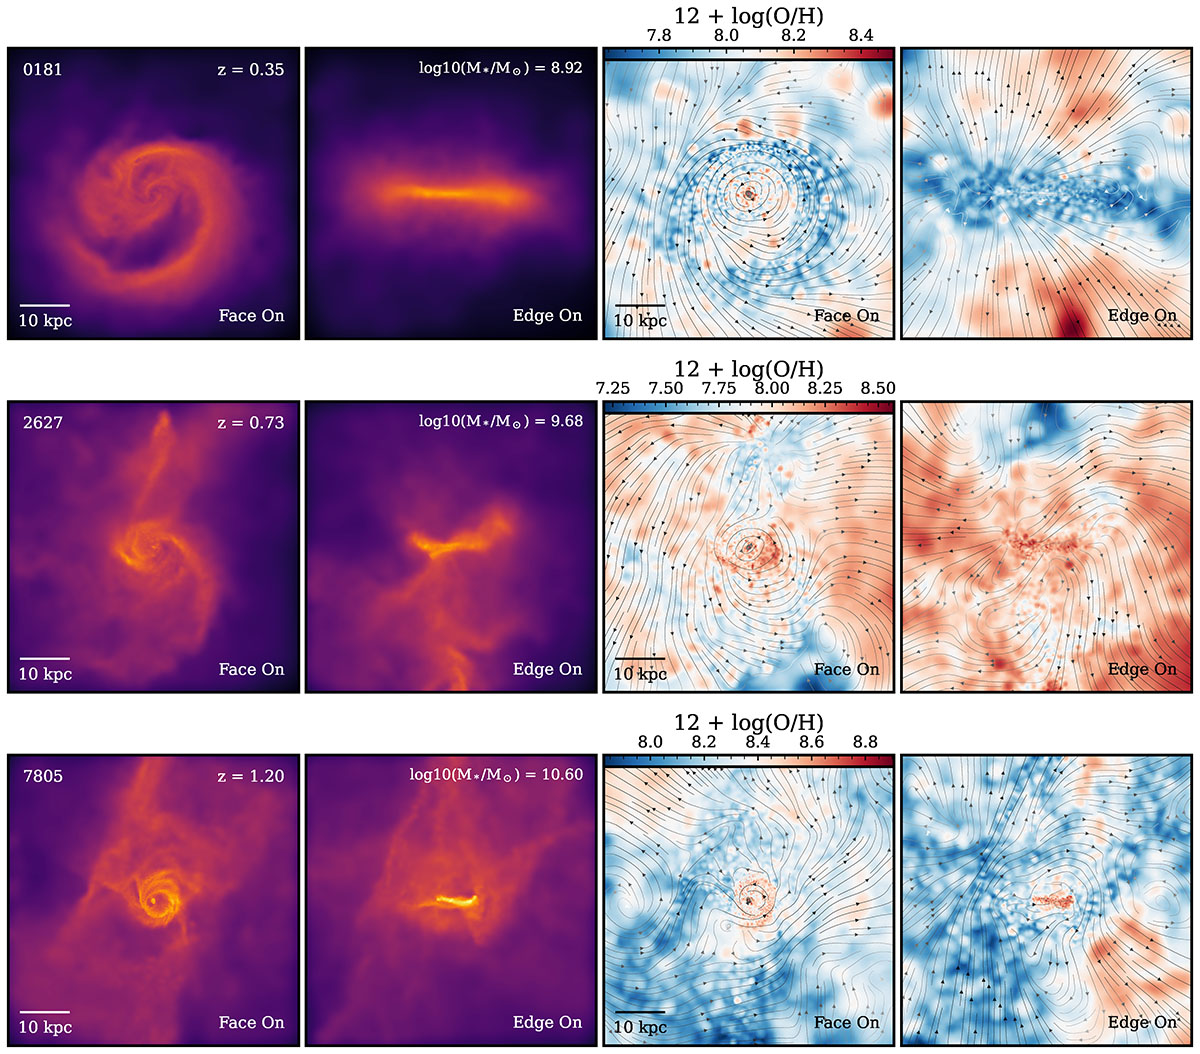
Face-on and edge-on projected gas density (first two panels, respectively) and the corresponding (O/H) (two right panels) distributions for three selected galaxies of the CIELO-P7 sample: 0181, 2627, and 7805, taken as examples. Each row shows a galaxy at a key stage of its evolution where gas outflows are detected. The M* of the galaxies at redshift z = 0 is shown in each plot. The streamlines depict the median velocity direction of the gas components. The first two galaxies are more rotationally dominated, while the third galaxy has a complex gas structure resulting from a recent gas-rich interaction.
Current usage metrics show cumulative count of Article Views (full-text article views including HTML views, PDF and ePub downloads, according to the available data) and Abstracts Views on Vision4Press platform.
Data correspond to usage on the plateform after 2015. The current usage metrics is available 48-96 hours after online publication and is updated daily on week days.
Initial download of the metrics may take a while.