Fig. 10.
Download original image
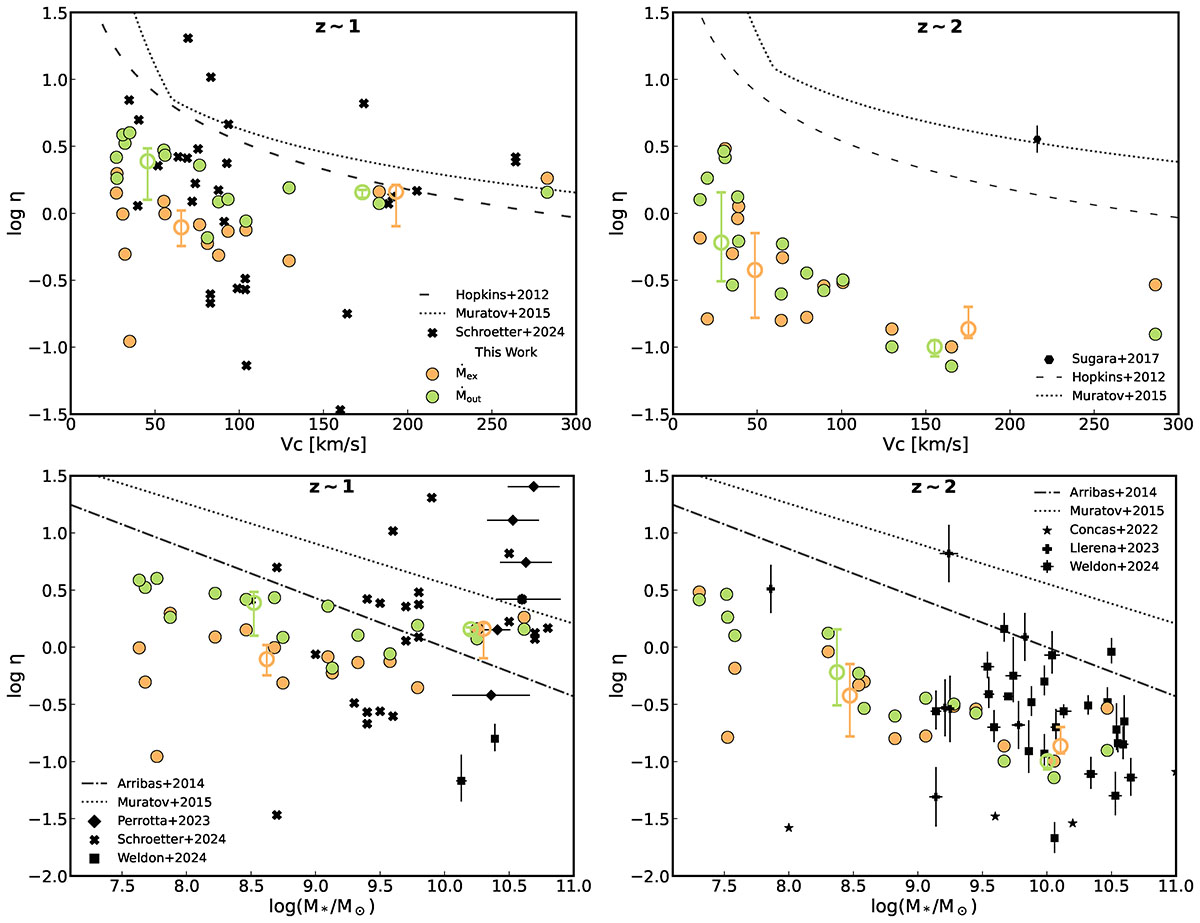
Mass-loading factor, η, as a function of circular velocity, Vc (upper-panel) and stellar mass, M* (bottom-panel). Symbols and solid lines for this work and Perrotta et al. (2023) are previously described in Fig. 8. Observational data of star-forming galaxies from MEGAFLOW survey (Schroetter et al. 2016) by Schroetter et al. (2024, black cross) and of star-forming galaxies from the MOSFIRE survey by Weldon et al. (2024, black squares) are shown, both at z ∼ 1. Observations at z ∼ 2 of a star-forming galaxy from Sugahara et al. (2017, black hexagon), of main-sequence galaxies from the KLEVER survey by Concas et al. (2022, black stars) and low-mass star-forming galaxies by Llerena et al. (2023, black cross) are also displayed. The best-fitting regression reported by Muratov et al. (2015) previously described in Fig. 9, ![]() for the relation reported by Hopkins et al. (2012, black dashed line) for z ∼ 1 and
for the relation reported by Hopkins et al. (2012, black dashed line) for z ∼ 1 and ![]() by Arribas et al. (2014, dashed dotted lines) is shown. Median of log10(M*) are artificially displayed by +0.05 dex for the expelled mass rate and −0.05 dex for the unbound outflows, and the median of Vc is artificially moved +10 km/s for the expelled mass rate (orange circles) and −10 km/s for the unbound outflows (green circles), for visualisation purposes only.
by Arribas et al. (2014, dashed dotted lines) is shown. Median of log10(M*) are artificially displayed by +0.05 dex for the expelled mass rate and −0.05 dex for the unbound outflows, and the median of Vc is artificially moved +10 km/s for the expelled mass rate (orange circles) and −10 km/s for the unbound outflows (green circles), for visualisation purposes only.
Current usage metrics show cumulative count of Article Views (full-text article views including HTML views, PDF and ePub downloads, according to the available data) and Abstracts Views on Vision4Press platform.
Data correspond to usage on the plateform after 2015. The current usage metrics is available 48-96 hours after online publication and is updated daily on week days.
Initial download of the metrics may take a while.