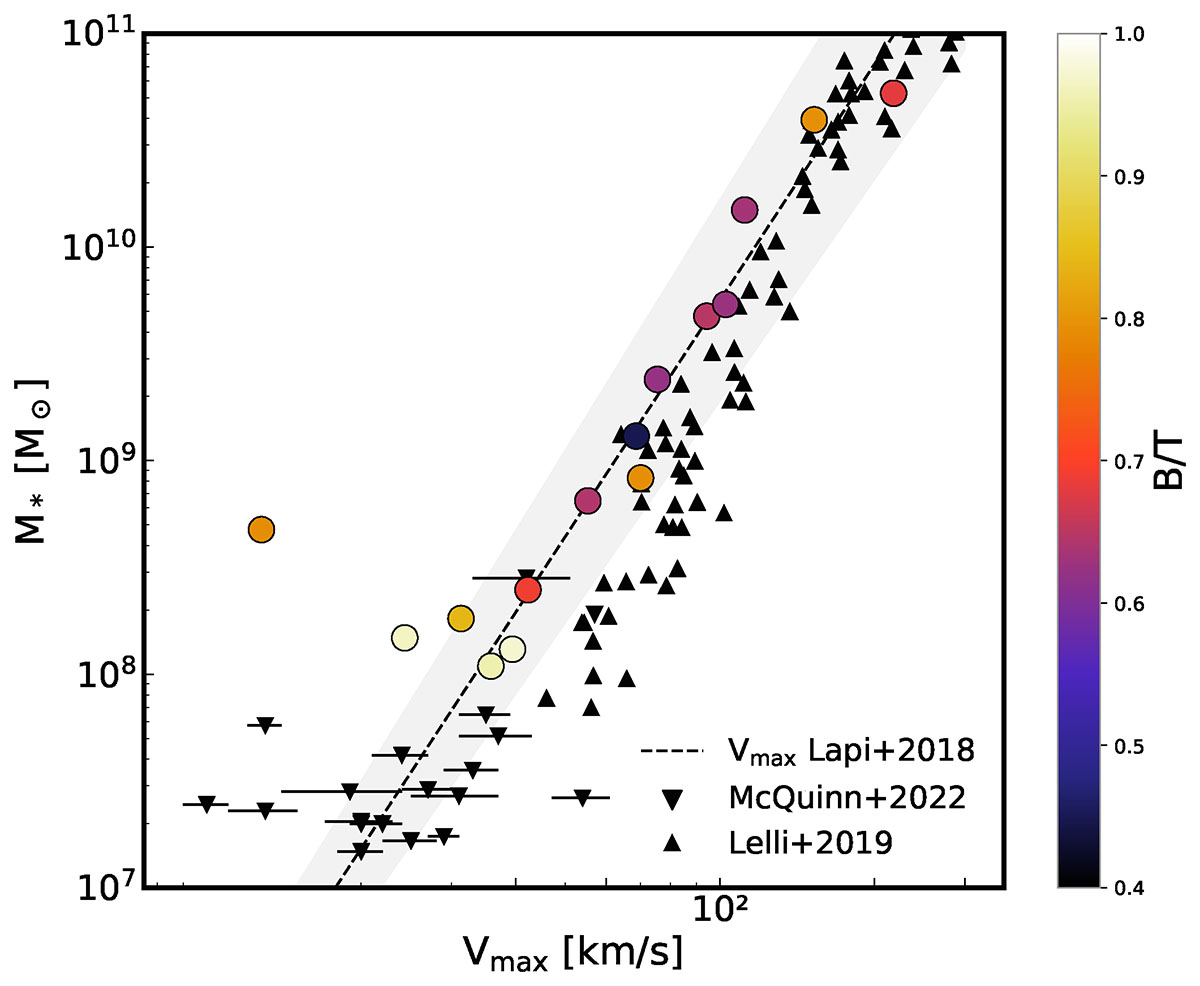
Fig. A.1.
Download original image
The Tully-Fisher relation obtained by using the maximum rotational velocity, Vmax, for the CIELO galaxies, coloured by B/T. Observations by McQuinn et al. (2022, downwards-pointing black triangles) and Lelli et al. (2019, black triangles) are displayed from comparison. The best-fitting regression for the data of Lapi et al. (2018) is also shown (black, dashed line). The shaded region is defined by 1σ.
Current usage metrics show cumulative count of Article Views (full-text article views including HTML views, PDF and ePub downloads, according to the available data) and Abstracts Views on Vision4Press platform.
Data correspond to usage on the plateform after 2015. The current usage metrics is available 48-96 hours after online publication and is updated daily on week days.
Initial download of the metrics may take a while.