Fig. 2.
Download original image
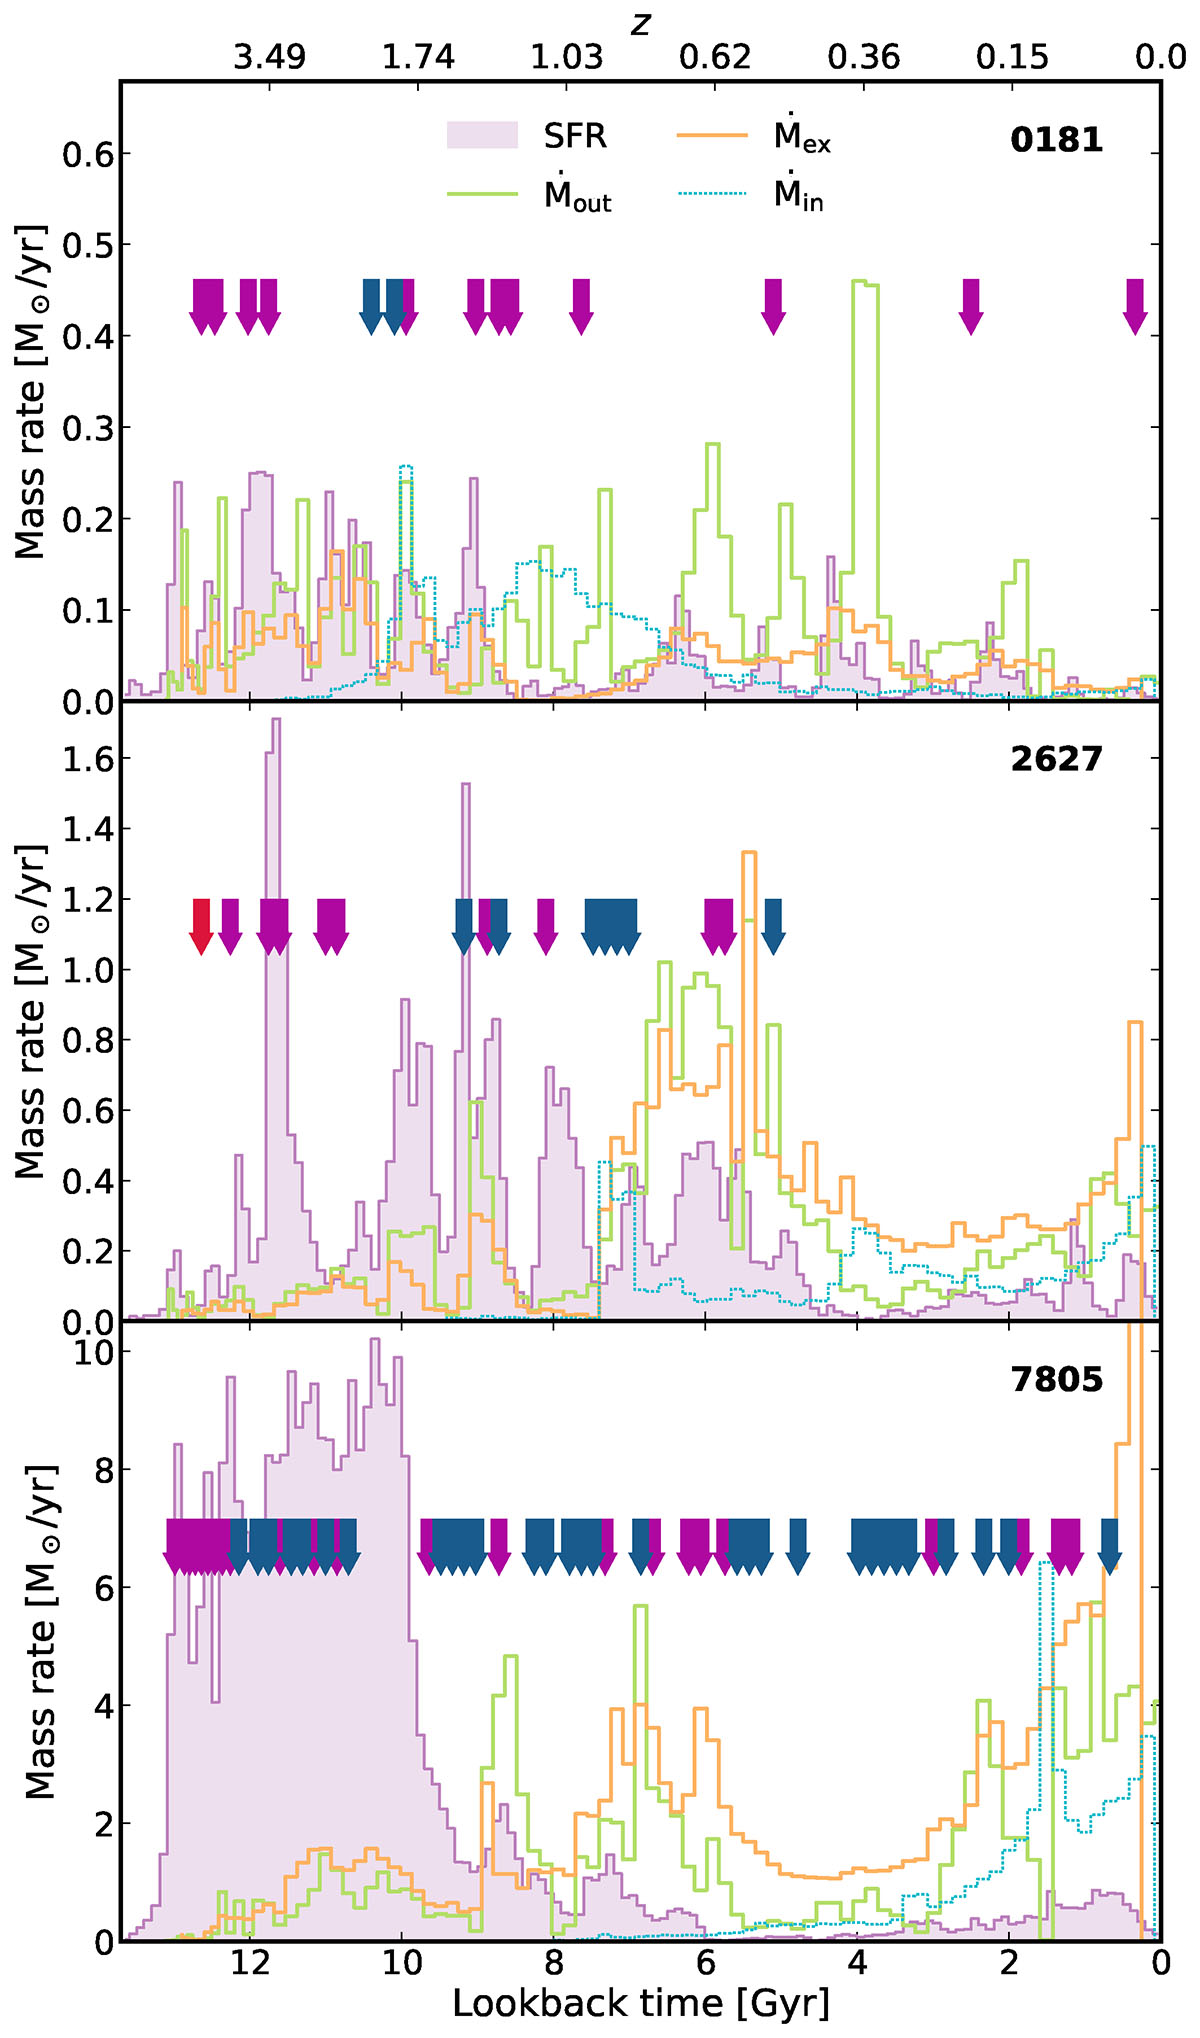
Three galaxies as examples: evolution of SFR (purple shading), Ṁout, the rate of unbound outflow for the inner shell [1.5Ropt, 0.5R200) (solid green lines), Ṁex, the expelled mass rates (solid orange lines), and Ṁin, the inflow mass rate (dotted cyan line) as a function of lookback time (the inset labels denote the galaxy ID). The infall time of satellites (blue arrows) entering the virial radius and the time of minor and major mergers (pink and red arrows, respectively) are also indicated (see Fig. C.1 to see the diversity of behaviour in our sample).
Current usage metrics show cumulative count of Article Views (full-text article views including HTML views, PDF and ePub downloads, according to the available data) and Abstracts Views on Vision4Press platform.
Data correspond to usage on the plateform after 2015. The current usage metrics is available 48-96 hours after online publication and is updated daily on week days.
Initial download of the metrics may take a while.