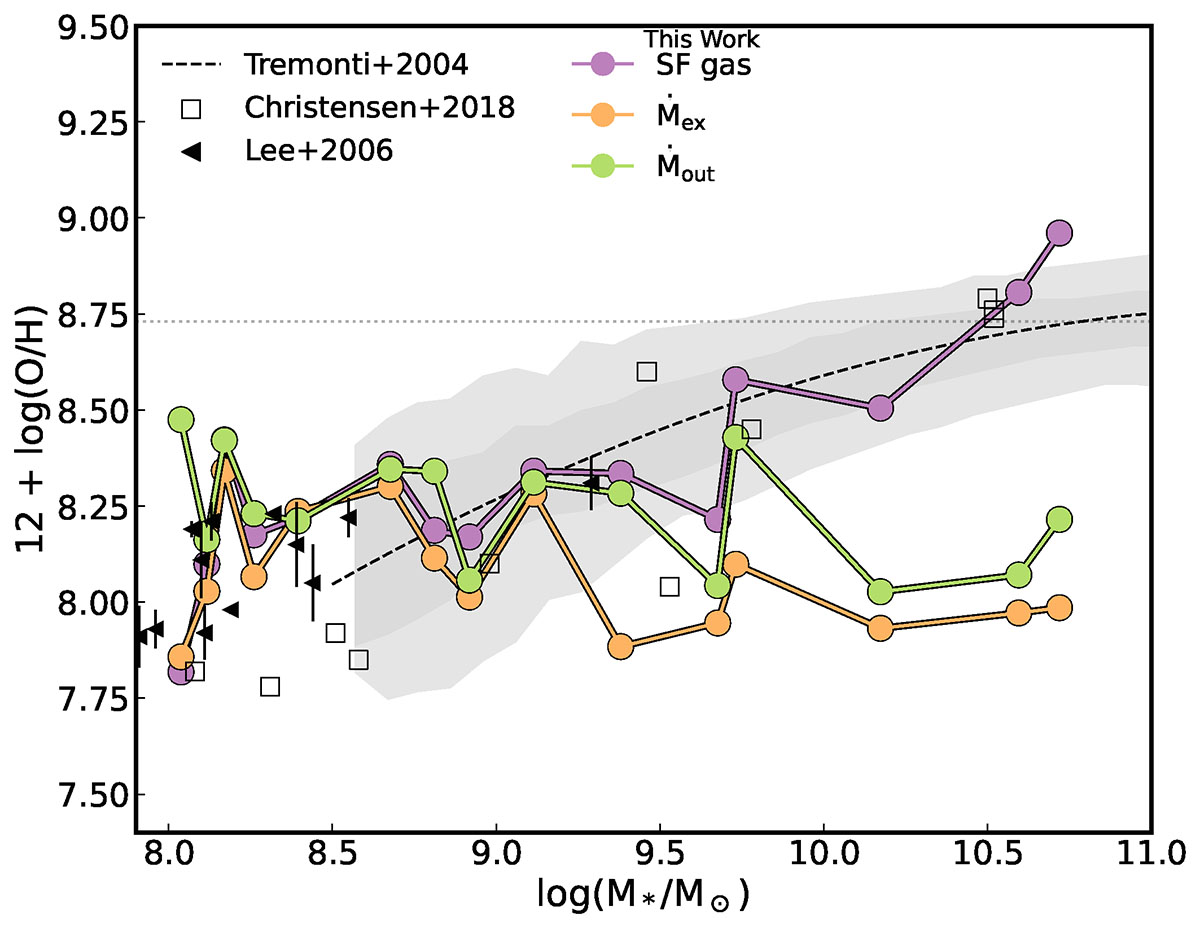
Fig. 4.
Download original image
Mass-metallicity relation for unbound outflows in the first radial interval of the CGM (green circles), for the expelled mass rates (orange circles), and for the star-forming gas (purple circles) for each analysed galaxy. Solid lines are only included to facilitate the visualisation. Observations from Lee et al. (2006, leftwards-pointing triangles) and simulations from Christensen et al. (2018, black squares) are shown. The MZR relation by Tremonti et al. (2004) scaled to solar values of Lodders (2019, dotted line) is shown in dashed black line. The 16-84 percentiles (dark grey contours) and the 2.5–97.5 percentiles (light grey contours) scaled from Tremonti et al. (2004) are also displayed.
Current usage metrics show cumulative count of Article Views (full-text article views including HTML views, PDF and ePub downloads, according to the available data) and Abstracts Views on Vision4Press platform.
Data correspond to usage on the plateform after 2015. The current usage metrics is available 48-96 hours after online publication and is updated daily on week days.
Initial download of the metrics may take a while.