Fig. 8.
Download original image
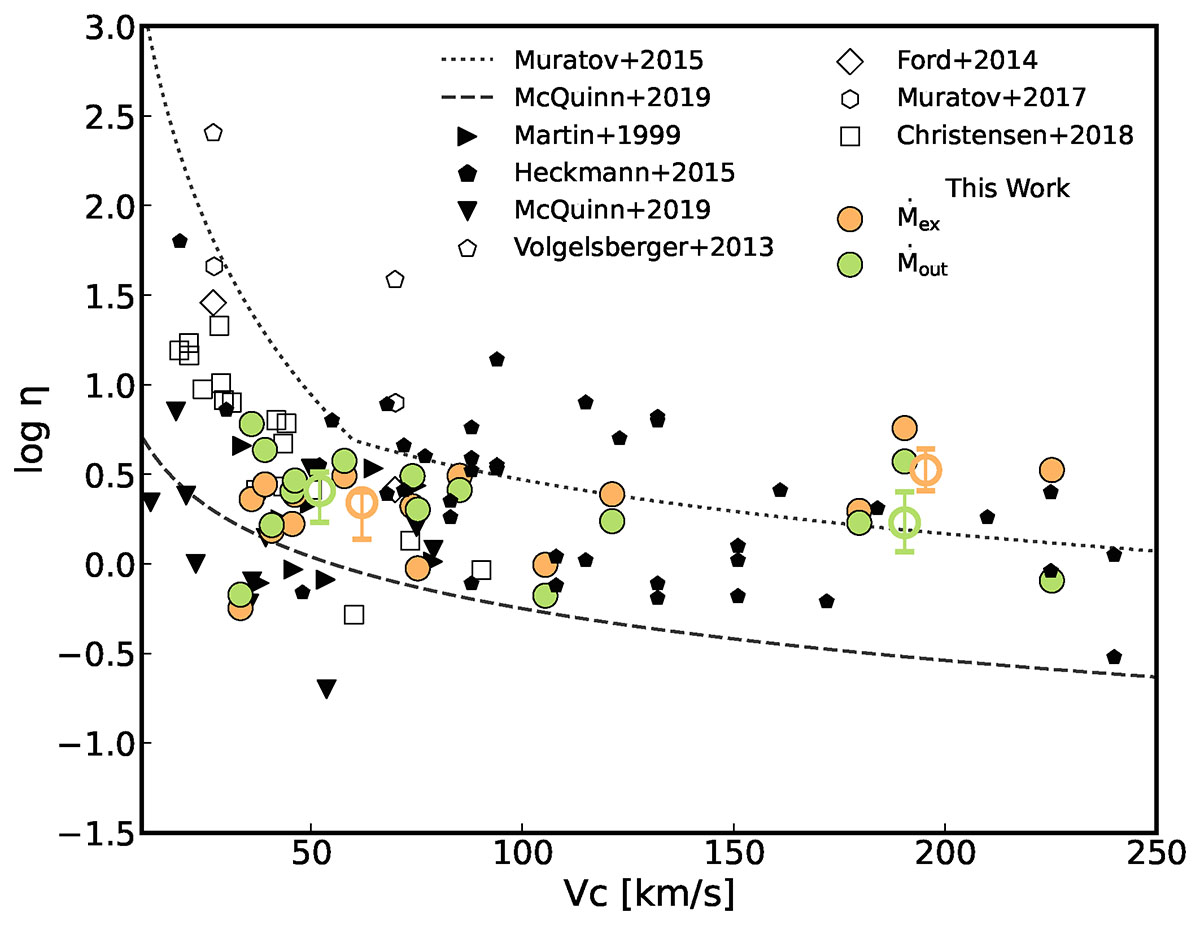
Mass-loading factors as a function of Vc for CIELO galaxies for z ≤ 0.5, using the unbound outflow (green circles), and the expelled mass rates (orange circles). Observational data of dwarf, spiral, and starburst galaxies from Martin (1999, rightwards-pointing black filled triangles), and of nearby dwarf galaxies from McQuinn et al. (2019, downwards-pointing black solid triangles) are shown for comparison. Additionally, numerical estimations from Vogelsberger et al. (2013, black open pentagons), Ford et al. (2014, black open diamonds), Muratov et al. (2017, black open hexagons), and Christensen et al. (2018, black open squares). The best fitting regression for the ![]() with α = 3.2 for Vc ≤ 60 km s−1 and α = 1 for Vc > 60 km s−1 at z = 0.25 reported by Muratov et al. (2015, black dotted line) and for the
with α = 3.2 for Vc ≤ 60 km s−1 and α = 1 for Vc > 60 km s−1 at z = 0.25 reported by Muratov et al. (2015, black dotted line) and for the ![]() relation reported by McQuinn et al. (2019, dashed black lines) is also depicted. Median values for ηout (green open circles) and for ηex (orange open circles) in two mass bins, sub-MW and high-mass galaxies are shown with the corresponding 25–75th percentiles. For visualisation purposes the median values of Vc for the expelled mass rate measurements have been artificially moved +10 km/s.
relation reported by McQuinn et al. (2019, dashed black lines) is also depicted. Median values for ηout (green open circles) and for ηex (orange open circles) in two mass bins, sub-MW and high-mass galaxies are shown with the corresponding 25–75th percentiles. For visualisation purposes the median values of Vc for the expelled mass rate measurements have been artificially moved +10 km/s.
Current usage metrics show cumulative count of Article Views (full-text article views including HTML views, PDF and ePub downloads, according to the available data) and Abstracts Views on Vision4Press platform.
Data correspond to usage on the plateform after 2015. The current usage metrics is available 48-96 hours after online publication and is updated daily on week days.
Initial download of the metrics may take a while.