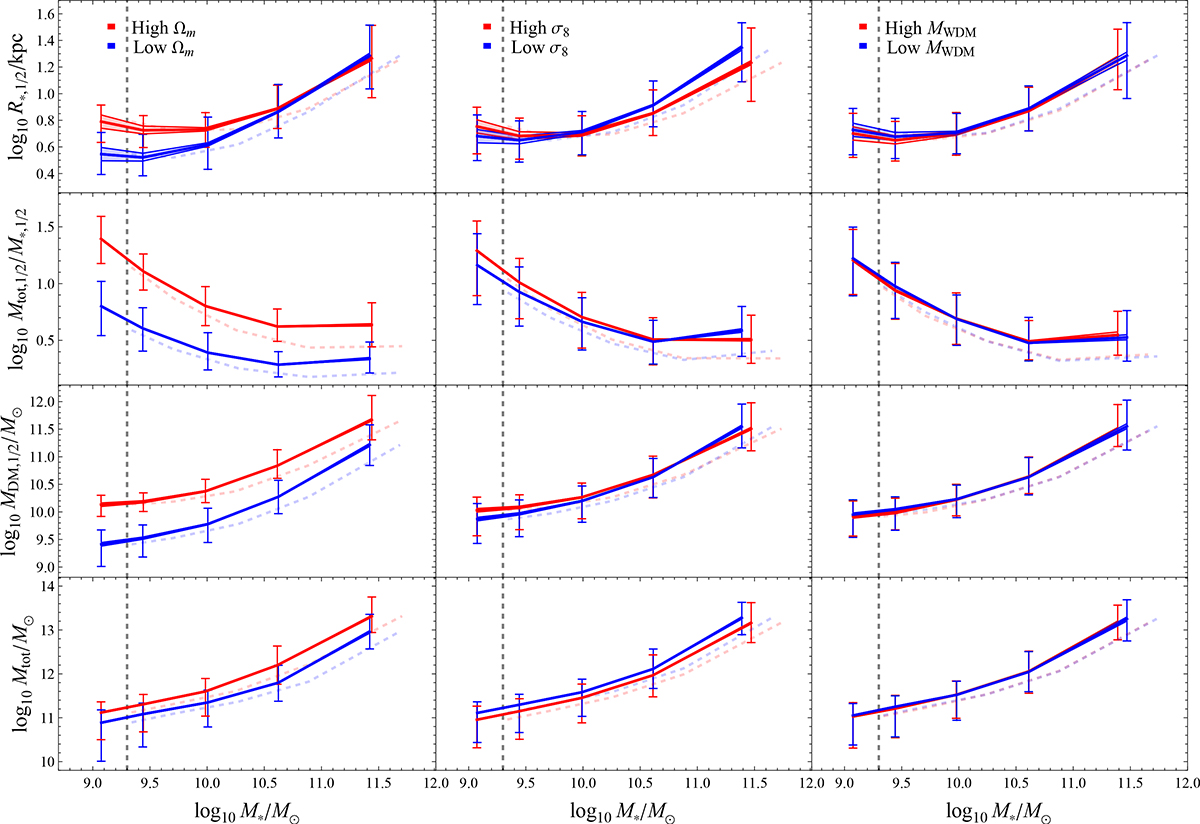
Fig. 1.
Download original image
Median scaling relations as a function of total stellar mass illustrating the dependence on cosmological parameters. The relations for stellar half-mass radius, total-to-stellar mass ratio within the stellar half-mass radius, DM mass within the stellar half-mass radius, and total galaxy mass are shown for both uncalibrated (solid line) and calibrated (dashed line) cases. Trends were calculated using galaxies from 1024 uniform-box simulations divided into the following stellar mass intervals: log10M*/M⊙ < 9.3, 9.3 ≤ log10M*/M⊙ < 9.6, 9.6 ≤ log10M*/M⊙ < 10.4, 10.4 ≤ log10M*/M⊙ < 11.2, and log10M*/M⊙ ≥ 11.2. Red and blue indicate trends for high and low parameter values, respectively, while the dashed gray line marks the threshold N*, 1/2 = 50. The thresholds and median values for the parameters are provided in Table 1. Error bars represent the scatter (16th–84th percentile range), while shaded areas indicate uncertainty estimates on the median values.
Current usage metrics show cumulative count of Article Views (full-text article views including HTML views, PDF and ePub downloads, according to the available data) and Abstracts Views on Vision4Press platform.
Data correspond to usage on the plateform after 2015. The current usage metrics is available 48-96 hours after online publication and is updated daily on week days.
Initial download of the metrics may take a while.