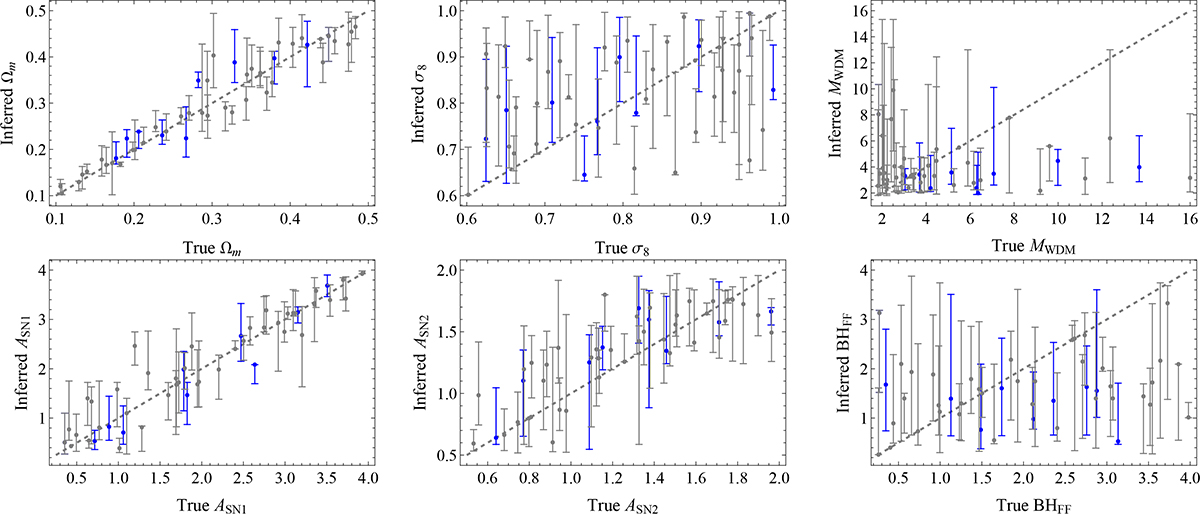
Fig. F.1.
Download original image
Recovery plot for the uniform-box simulations, showing the bootstrap results with uncertainties for the estimated parameters: Ωm, σ8, MWDM, ASN1, ASN2 and BHFF against their true values. These parameters are obtained by comparing the simulations with the corresponding simulation outputs mimicking the SPARC catalog. The dashed gray line indicates the ideal one-to-one relation between estimated and true parameter values. Blue points correspond to the reference analysis with N = 100, while grey points show the test performed with N = 10.
Current usage metrics show cumulative count of Article Views (full-text article views including HTML views, PDF and ePub downloads, according to the available data) and Abstracts Views on Vision4Press platform.
Data correspond to usage on the plateform after 2015. The current usage metrics is available 48-96 hours after online publication and is updated daily on week days.
Initial download of the metrics may take a while.