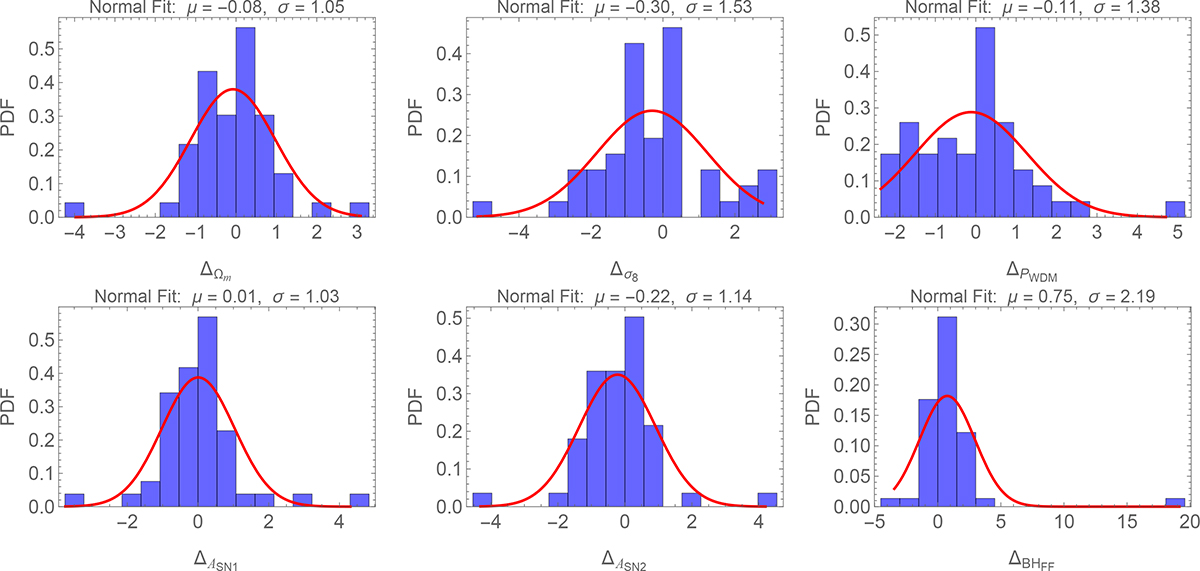
Fig. F.2.
Download original image
Normalized residual distributions (Δp) for all parameters in the uniform-box suite. Each panel shows the empirical distribution (histogram) together with a Gaussian fit (red solid curve); the fitted mean (μ) and standard deviation (σ) are indicated in each panel. Histograms are normalized to unit area using Mathematica’s "PDF" option, allowing direct comparison with a standard normal.
Current usage metrics show cumulative count of Article Views (full-text article views including HTML views, PDF and ePub downloads, according to the available data) and Abstracts Views on Vision4Press platform.
Data correspond to usage on the plateform after 2015. The current usage metrics is available 48-96 hours after online publication and is updated daily on week days.
Initial download of the metrics may take a while.