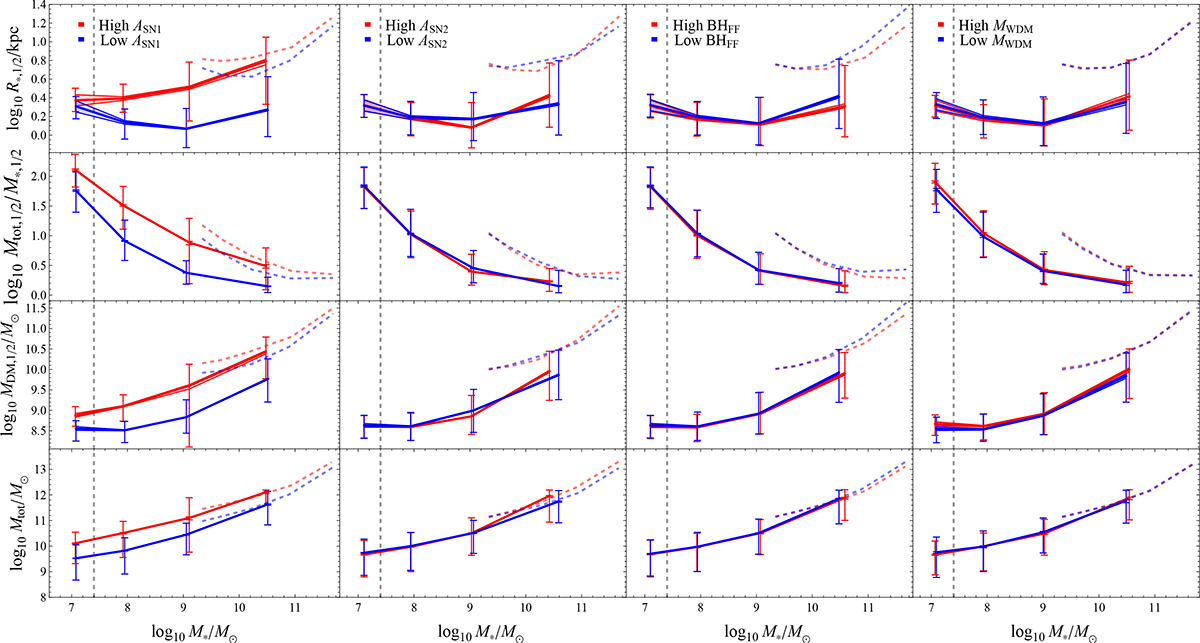
Fig. 3.
Download original image
Median scaling relations as a function of total stellar mass showing the dependence on astrophysical parameters and WDM mass for both MW zoom-in simulations (solid line) and calibrated uniform-box simulations (dashed line) for comparison. Trends are derived from 1024 MW zoom-in simulations divided into the following stellar mass intervals: log10M*/M⊙ < 7.5, 7.5 ≤ log10M*/M⊙ < 8.5, 8.5 ≤ log10M*/M⊙ < 10, and log10M*/M⊙ ≥ 10. Red and blue indicate trends for high and low parameter values, respectively. The dashed gray line indicates N*, 1/2 = 50.
Current usage metrics show cumulative count of Article Views (full-text article views including HTML views, PDF and ePub downloads, according to the available data) and Abstracts Views on Vision4Press platform.
Data correspond to usage on the plateform after 2015. The current usage metrics is available 48-96 hours after online publication and is updated daily on week days.
Initial download of the metrics may take a while.