Fig. 5.
Download original image
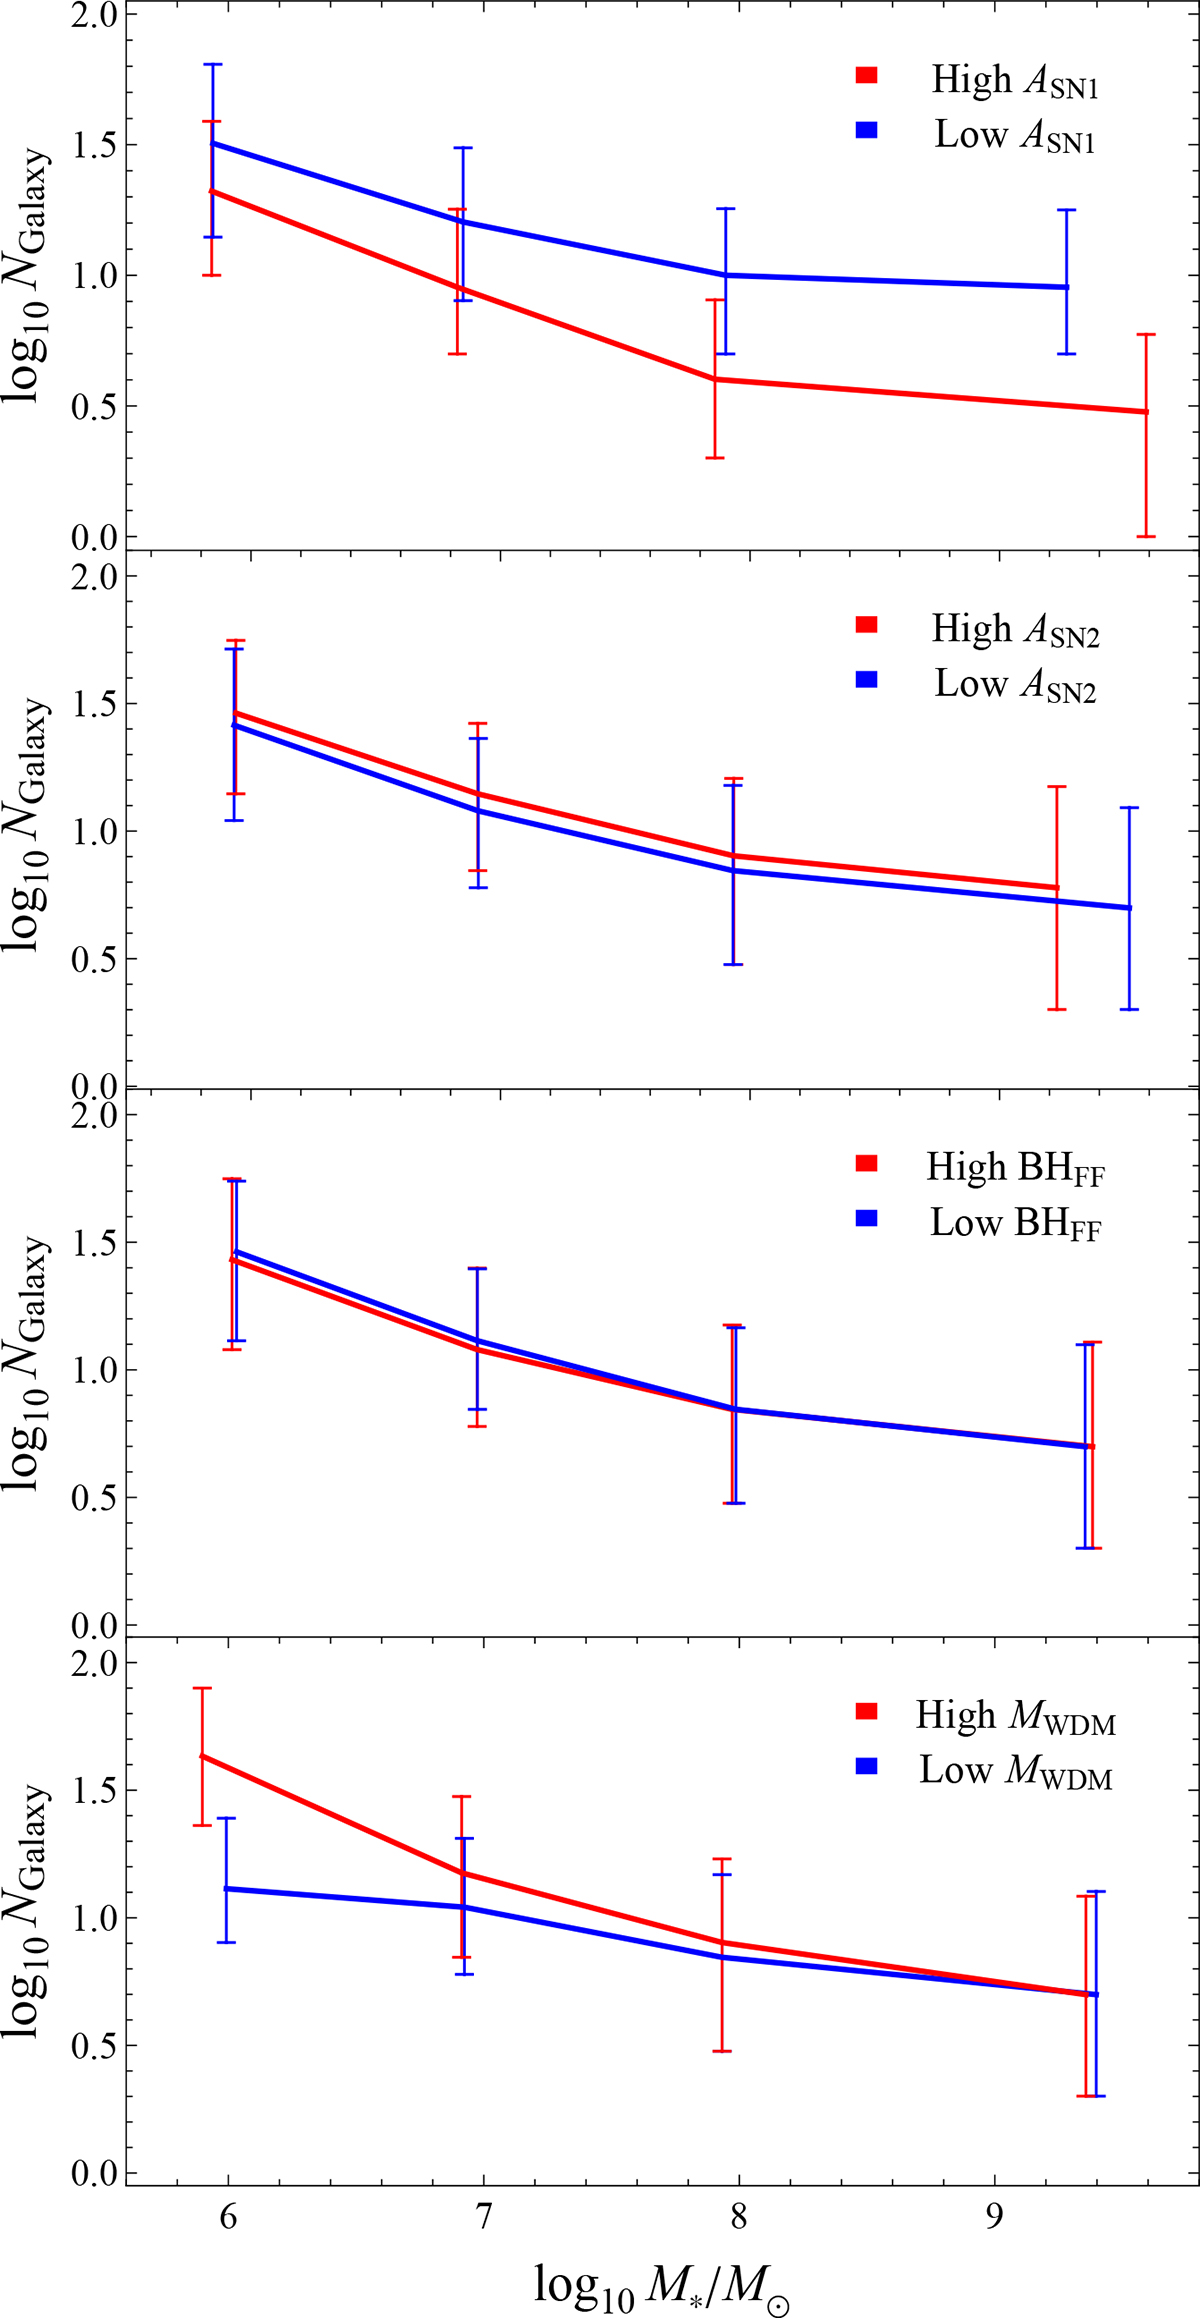
Median number of galaxies as a function of median total stellar mass computed in the stellar mass bins log10M*/M⊙ < 6.5, 6.5 ≤ log10M*/M⊙ < 7.5, 7.5 ≤ log10M*/M⊙ < 8.5, and log10M*/M⊙ ≥ 8.5. The four panels, from top to bottom, correspond to variations in ASN1, ASN2, BHFF, and MWDM, respectively. In each case, the red and blue curves represent parameter values above and below the thresholds listed in Table 1, respectively. The plots are based on the 1024 MW zoom-in simulations from DREAMS.
Current usage metrics show cumulative count of Article Views (full-text article views including HTML views, PDF and ePub downloads, according to the available data) and Abstracts Views on Vision4Press platform.
Data correspond to usage on the plateform after 2015. The current usage metrics is available 48-96 hours after online publication and is updated daily on week days.
Initial download of the metrics may take a while.