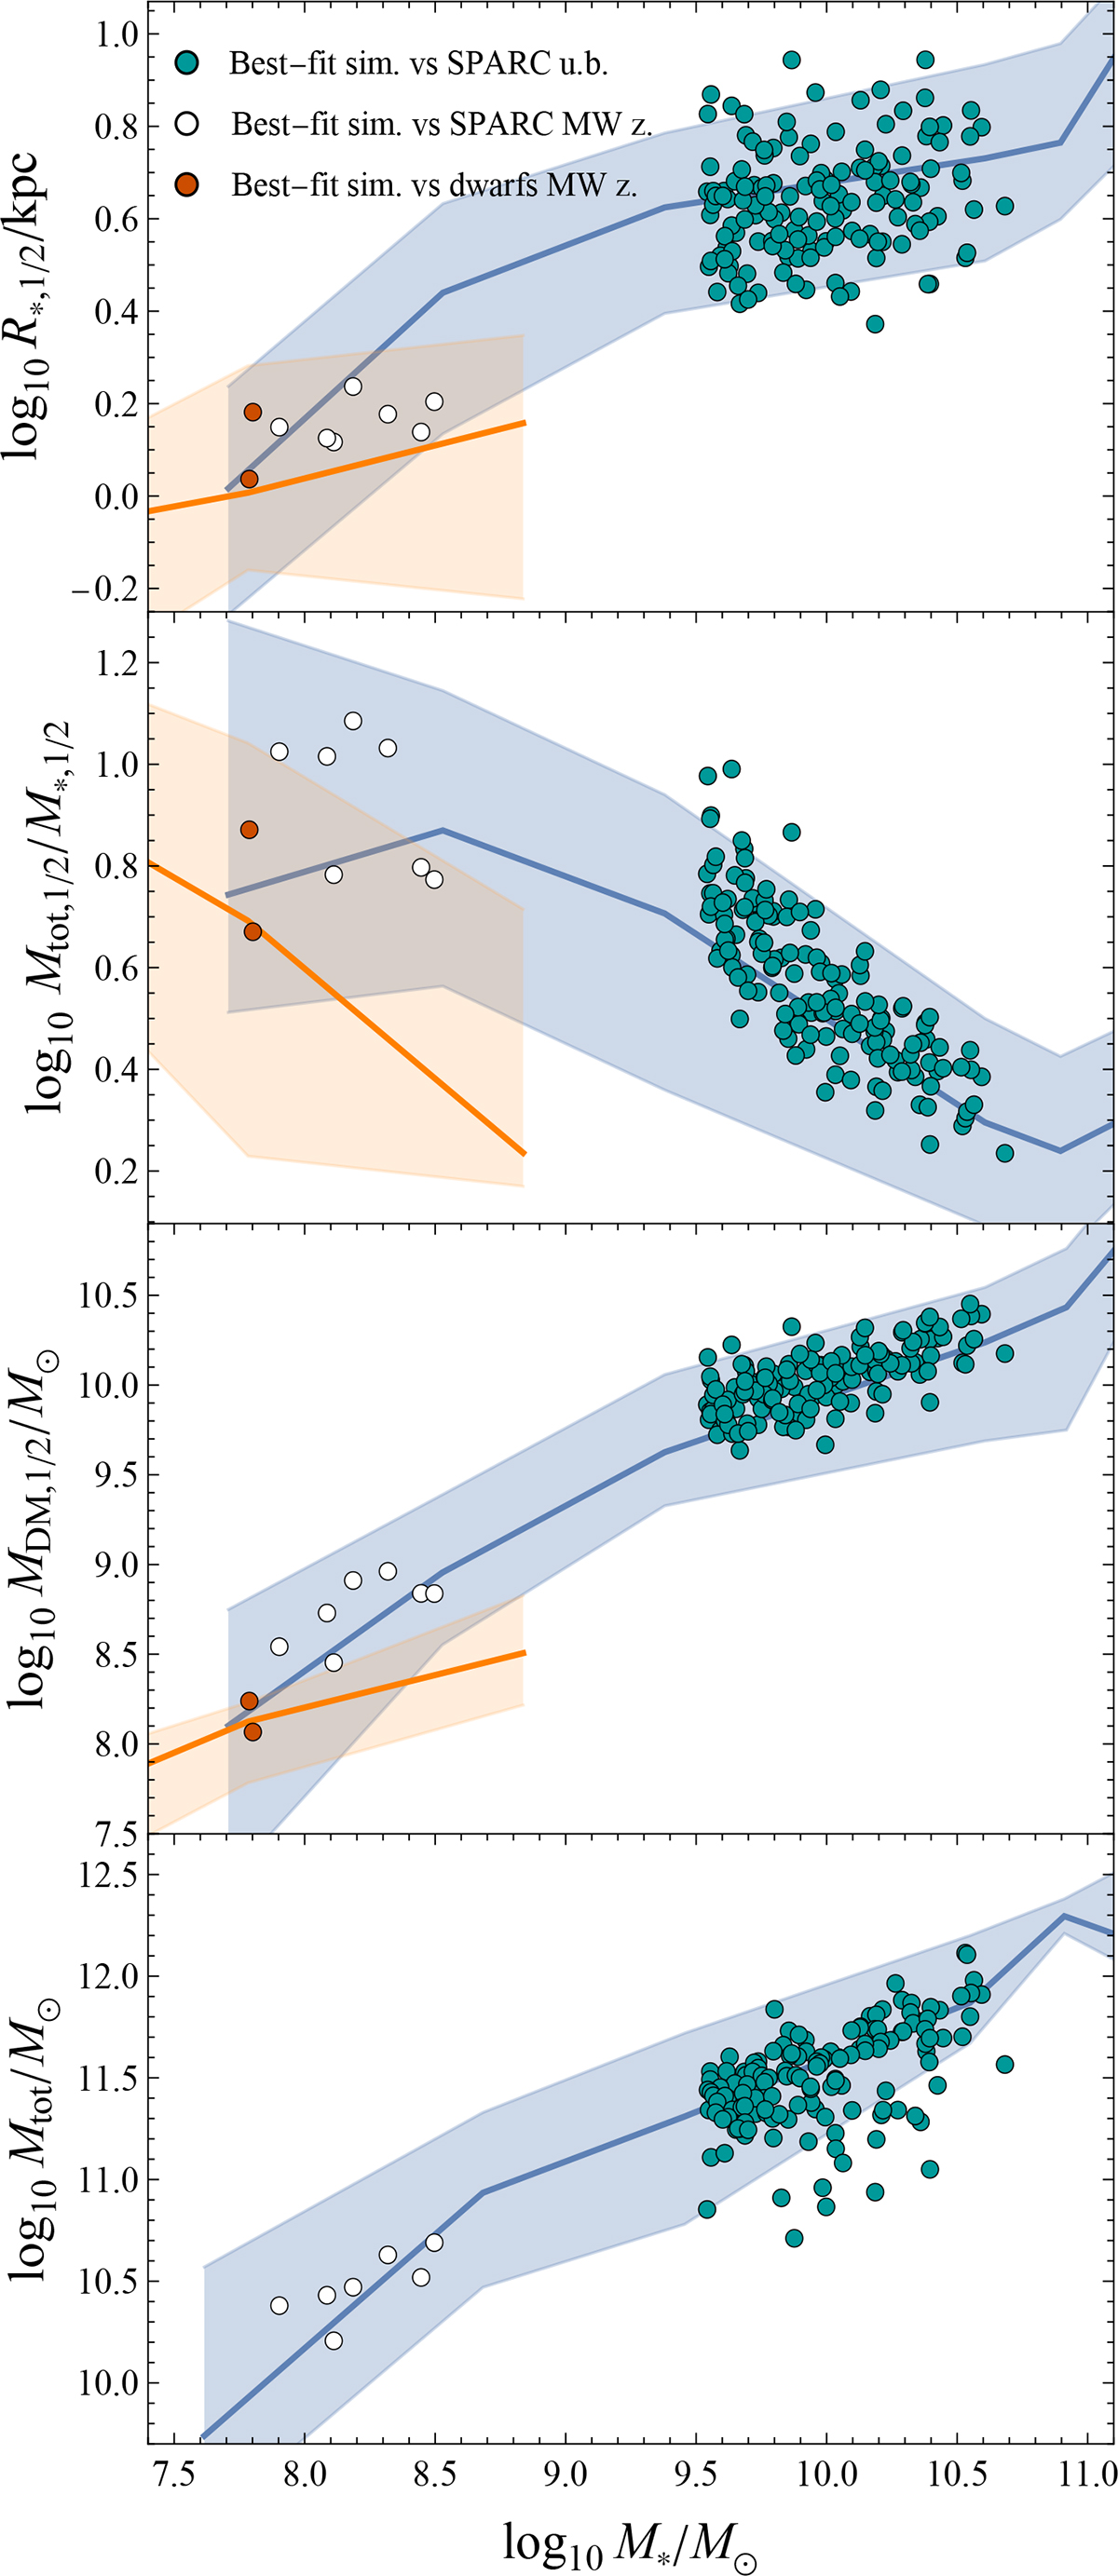
Fig. 8.
Download original image
Best-fit simulations (points) compared to median observational trends (shaded areas) from SPARC (green) and the dwarf catalog (orange). From top to bottom: Stellar half-mass radius, total-to-stellar mass ratio within R*, 1/2, DM mass within R*, 1/2, and total versus stellar mass. Green points indicate the best-fit uniform-box versus SPARC, white points represent the MW zoom-in best matching SPARC, and orange points show the MW zoom-in best matching the dwarf catalog.
Current usage metrics show cumulative count of Article Views (full-text article views including HTML views, PDF and ePub downloads, according to the available data) and Abstracts Views on Vision4Press platform.
Data correspond to usage on the plateform after 2015. The current usage metrics is available 48-96 hours after online publication and is updated daily on week days.
Initial download of the metrics may take a while.