Fig. 10
Download original image
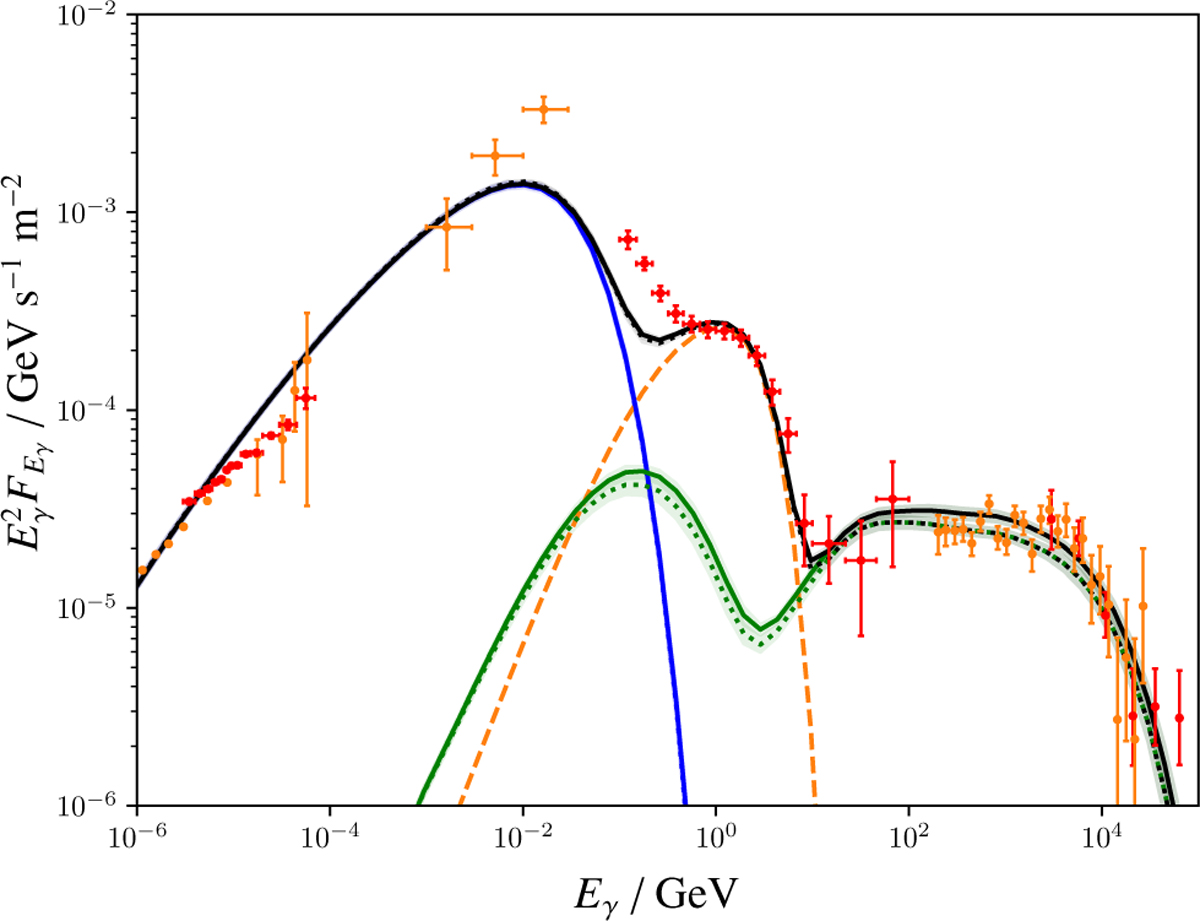
Spectral energy distribution of the non-thermal emission predicted in our model for LS 5039 with the total emission power reduced by a factor of 2 for both INFC phase intervals covered in our simulation. Here, we show synchrotron emission in blue and IC emission in green. Results for the first full orbit are shown as solid lines and those for the second full orbit as dotted lines. Additionally, the outer-gap model is shown in dashed orange. The observational data are the same as in Fig. 7.
Current usage metrics show cumulative count of Article Views (full-text article views including HTML views, PDF and ePub downloads, according to the available data) and Abstracts Views on Vision4Press platform.
Data correspond to usage on the plateform after 2015. The current usage metrics is available 48-96 hours after online publication and is updated daily on week days.
Initial download of the metrics may take a while.