Fig. 11
Download original image
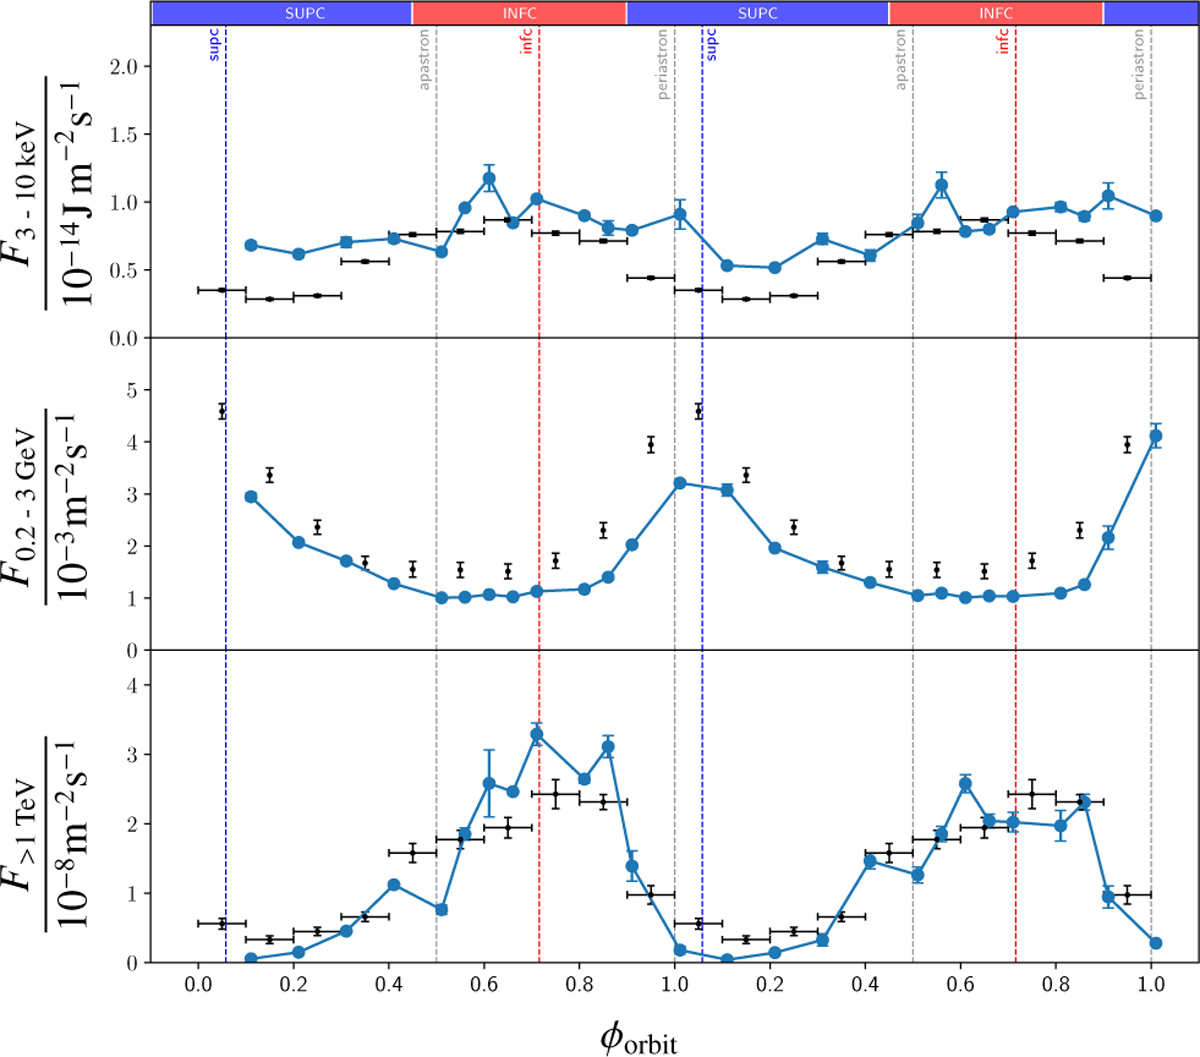
Light curve of LS 5039 in three different energy bands with the total emission power predicted by the model reduced by a factor of 2. Here, we show the model results in blue and corresponding data in black together with error bars where available. Our simulation results are given for an inclination of i = 60°. The individual energy bands are soft x-rays at an energy of 3-10 keV (top row, with data from Yoneda et al. 2020), HE gamma rays at an energy of 0.2-3 GeV (middle row, with data from Hadasch et al. 2012), and VHE gamma-rays with energies above 1 TeV (lower row, with data from Aharonian et al. 2006).
Current usage metrics show cumulative count of Article Views (full-text article views including HTML views, PDF and ePub downloads, according to the available data) and Abstracts Views on Vision4Press platform.
Data correspond to usage on the plateform after 2015. The current usage metrics is available 48-96 hours after online publication and is updated daily on week days.
Initial download of the metrics may take a while.