Fig. A.2
Download original image
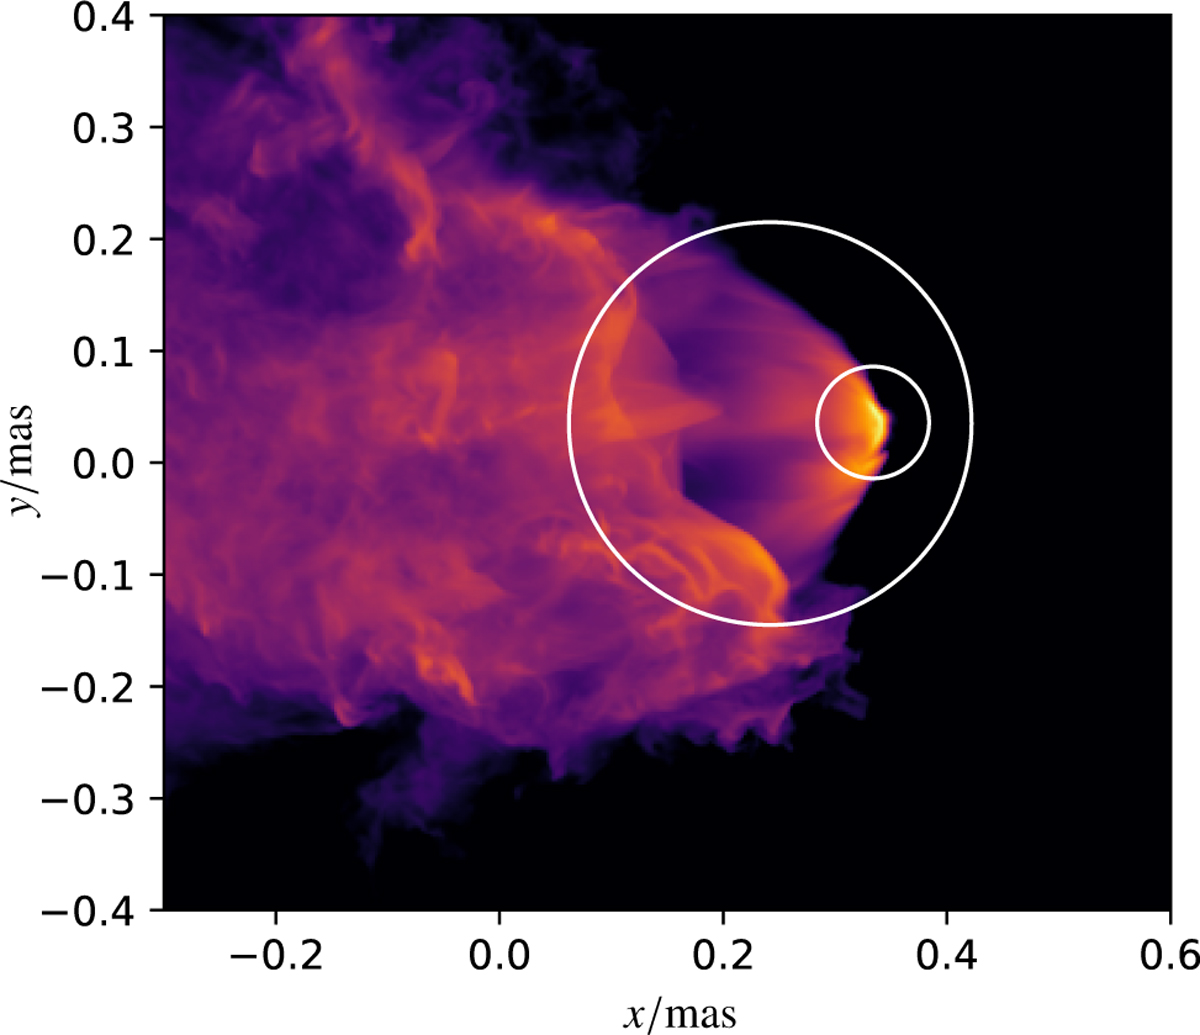
Analysis regions for emission-projection plots as shown in Fig. 8. Here, we show the corresponding circles overplotted over a projection for the synchrotron emission at 31.6 keV with an inclination of i = 60°. The small white circle indicates the region, for which we summed up the emission around the bow shock. The larger circle was used as an approximation for emission from the sheath around the pulsar, where the emission around the bow shock was subtracted.
Current usage metrics show cumulative count of Article Views (full-text article views including HTML views, PDF and ePub downloads, according to the available data) and Abstracts Views on Vision4Press platform.
Data correspond to usage on the plateform after 2015. The current usage metrics is available 48-96 hours after online publication and is updated daily on week days.
Initial download of the metrics may take a while.