Fig. 5
Download original image
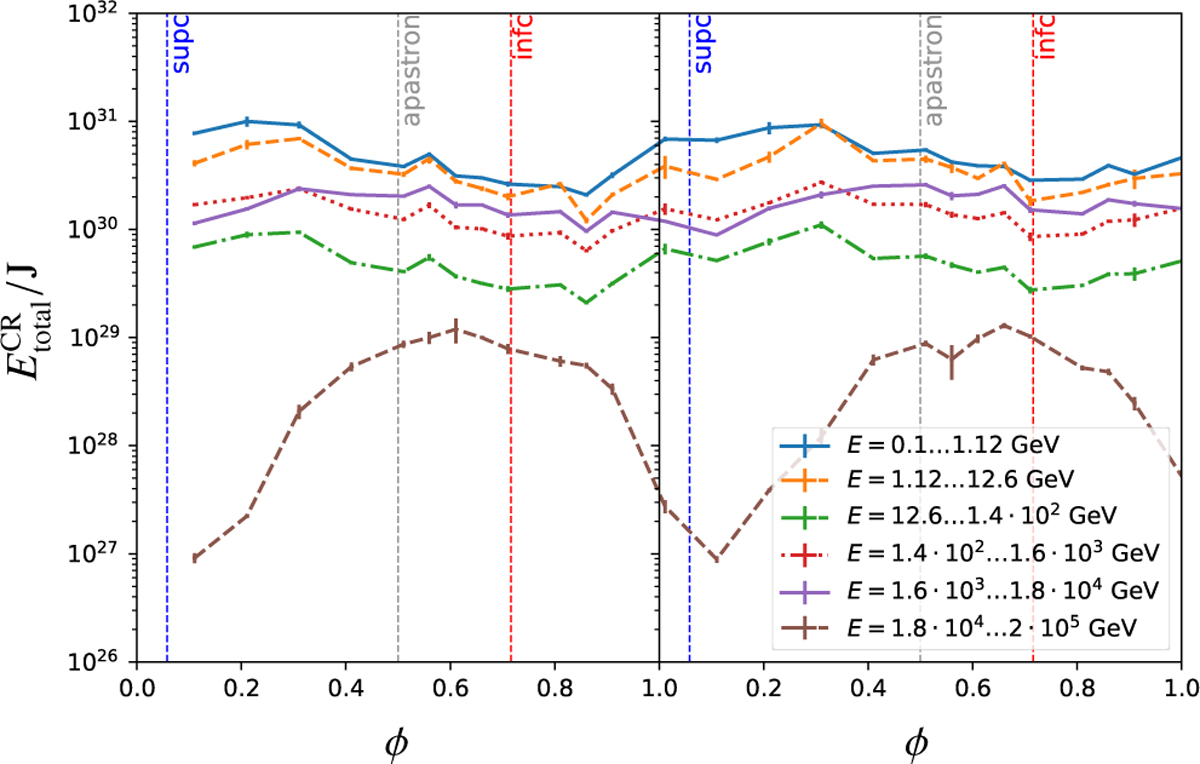
Temporal evolution of the integrated energy of energetic leptons ![]() within the total computational domain for several bins of particle energy as indicated in the plot. We show the results for the second (left) and third (right) orbit of our simulation. Relevant orbital phases are indicated in the plot via vertical lines, where additionally periastron is at φ = 0. The error bars indicate the short-time variation in the six phases used to compute each data point.
within the total computational domain for several bins of particle energy as indicated in the plot. We show the results for the second (left) and third (right) orbit of our simulation. Relevant orbital phases are indicated in the plot via vertical lines, where additionally periastron is at φ = 0. The error bars indicate the short-time variation in the six phases used to compute each data point.
Current usage metrics show cumulative count of Article Views (full-text article views including HTML views, PDF and ePub downloads, according to the available data) and Abstracts Views on Vision4Press platform.
Data correspond to usage on the plateform after 2015. The current usage metrics is available 48-96 hours after online publication and is updated daily on week days.
Initial download of the metrics may take a while.