Fig. 7
Download original image
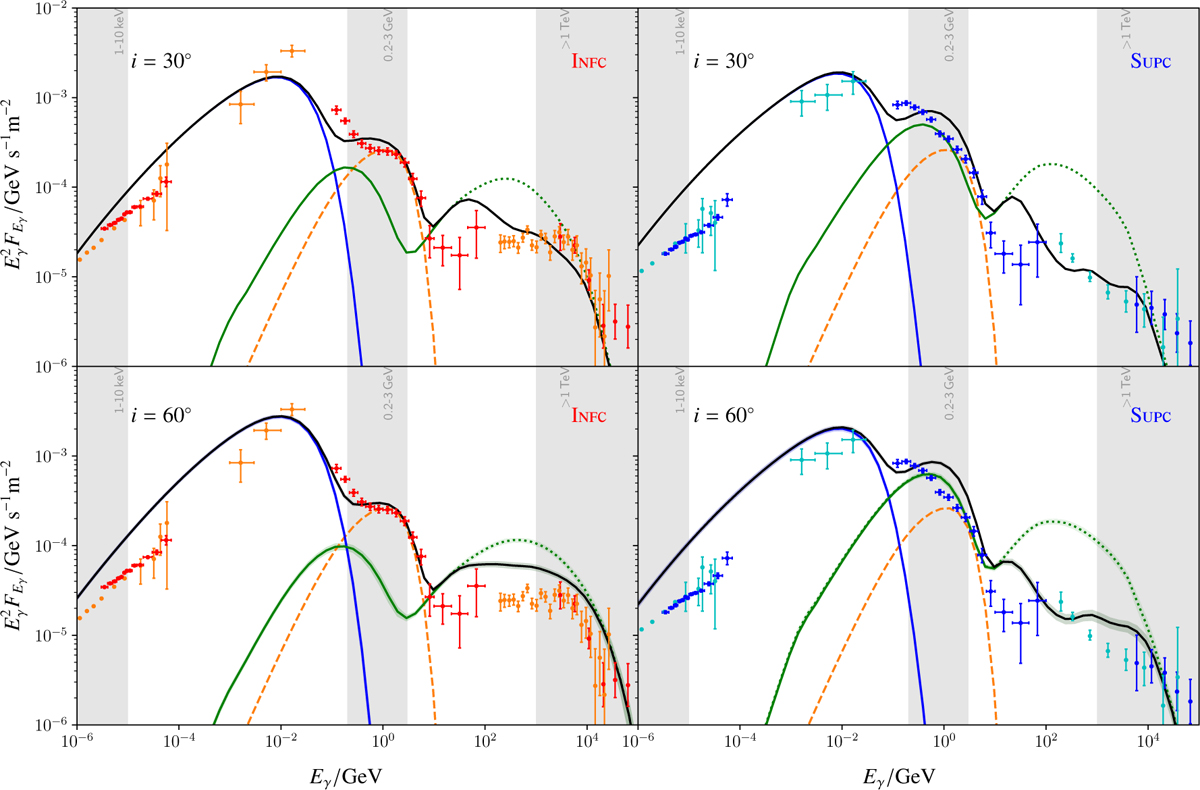
Phase-averaged spectral energy distribution of the non-thermal emission predicted by our model for the INFC (left) and the SUPC (right) period for inclinations of i = 60° (bottom) and i = 30° (top). The simulation results are shown together with observations in soft x-rays by Suzaku (Takahashi et al. 2009, orange and cyan) and NuSTAR (Yoneda et al. 2021, red and blue), as well as in LE gamma rays (Collmar & Zhang 2014, orange and cyan), in HE gamma rays (Yoneda et al. 2021, red and blue), and in VHE gamma rays by H.E.S.S. (Aharonian et al. 2006, orange and cyan) and by HAWC (Alfaro et al. 2025, red and blue). From the numerical model, we show synchrotron emission in blue, IC emission in green, and the magnetospheric emission of the pulsar (Takata et al. 2014) via the orange dashed curve. Additionally, we show IC emission without γγ-absorption via the green dotted curve. The standard deviation reflecting short-term variation of the spectrum is indicated by the transparent bands for the example of i = 60°. The total emission is given by the black solid curve. Additionally, we indicated the energies, over which we average to investigate the light curve in Fig. 9 via the grey bands.
Current usage metrics show cumulative count of Article Views (full-text article views including HTML views, PDF and ePub downloads, according to the available data) and Abstracts Views on Vision4Press platform.
Data correspond to usage on the plateform after 2015. The current usage metrics is available 48-96 hours after online publication and is updated daily on week days.
Initial download of the metrics may take a while.