Fig. 8
Download original image
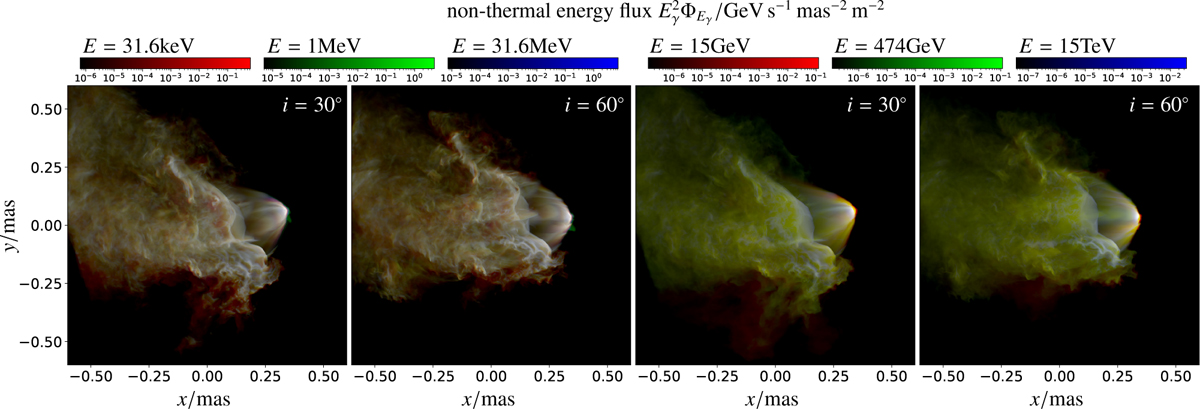
Example projections of the predicted emission for the synchrotron regime (two left-handed plots) and the IC regime (two right-handed plots). In both cases we show results for two different inclinations with i = 30° on the left and i = 60° on the right, respectively. Results are shown for an orbital phase of φ = 0.414 in the third full orbit (see also Fig. 3).
Current usage metrics show cumulative count of Article Views (full-text article views including HTML views, PDF and ePub downloads, according to the available data) and Abstracts Views on Vision4Press platform.
Data correspond to usage on the plateform after 2015. The current usage metrics is available 48-96 hours after online publication and is updated daily on week days.
Initial download of the metrics may take a while.