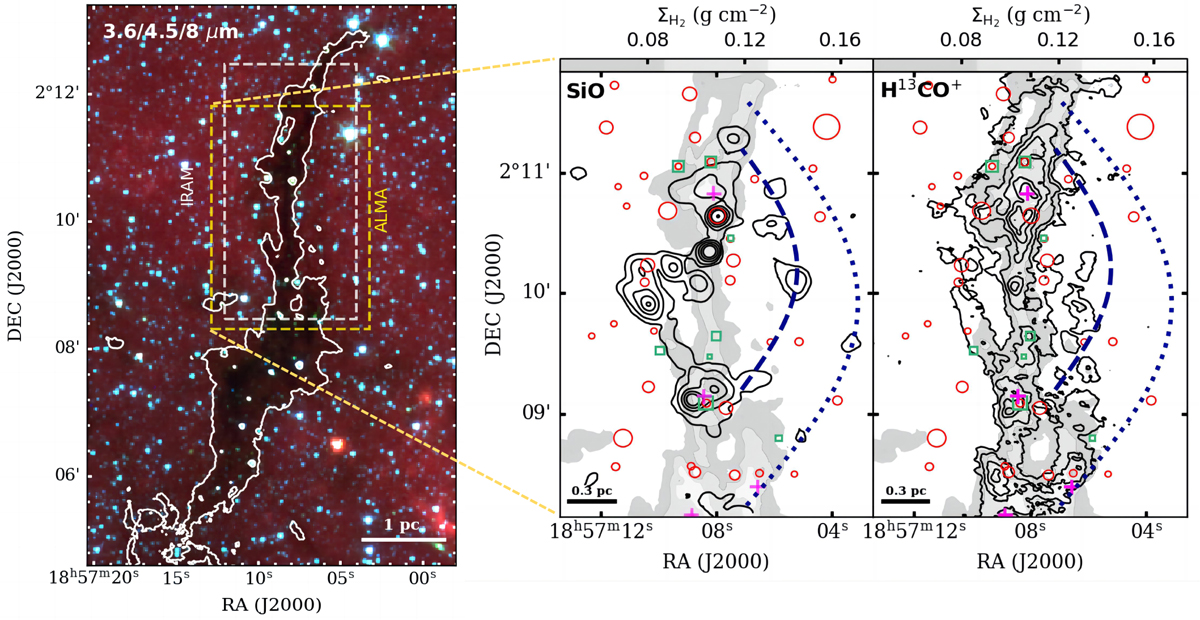
Fig. 1
Download original image
Spatial distribution of the SiO and H13CO+ emission towards the filamentary cloud G035.39–00.33. Left panel: three-colour image (red color = 8 µm, green color = 4.5 µm, blue = 3.6 µm) of Cloud H, obtained from GLIMPSE (Benjamin et al. 2003; Carey et al. 2009). The white contour highlights the dense material in the IRDC as shown by the mass surface extinction map of Kainulainen & Tan (2013), corresponding to an extinction level of AV= 10 mag. The dashed yellow and white rectangles are the fields of view for the ALMA and IRAM-30 m observations, respectively. The physical scale is shown in the lower-right corner. Right panels: spatial distribution of the SiO and H13CO+ emission towards Cloud H. The grey background colour scale shows the mass surface density, with contour levels of AV = 10, 20, 30, and 40 mag. The black contours represent SiO (2–1) and H13CO+ (1–0) emission from ALMA observations. The SiO data are spatially smoothed to a resolution of 6″, and the spectral resolution was degraded from 0.21 to 0.6 km s−1. The SiO contours are integrated over the velocity range from –20 to 120 km s−1, and levels are 21 (3σ), 210, 630, 1050, and 2300 (peak value) mJy beam−1 km s−1. The H13CO+ contours are integrated over the velocity range from 40 to 50 km s−1, with the levels of 15 (3σ), 50, 100, 151, 200, 253 (peak value) mJy beam−1 km s−1. Red open circles and medium green rectangles indicate the positions of 8 µm sources and 24 µm sources, respectively (Jiménez-Serra et al. 2010). The marker sizes for the 8 µm and 24 µm sources are scaled by the source flux. Magenta crosses mark the locations of the cores identified by Rathborne et al. (2006) using 1.2 mm continuum emission. Dark blue dashed and dotted lines trace the arc-like structures observed in the SiO emission. The physical scale is shown in the lower-left corner of each panel.
Current usage metrics show cumulative count of Article Views (full-text article views including HTML views, PDF and ePub downloads, according to the available data) and Abstracts Views on Vision4Press platform.
Data correspond to usage on the plateform after 2015. The current usage metrics is available 48-96 hours after online publication and is updated daily on week days.
Initial download of the metrics may take a while.