Fig. 2
Download original image
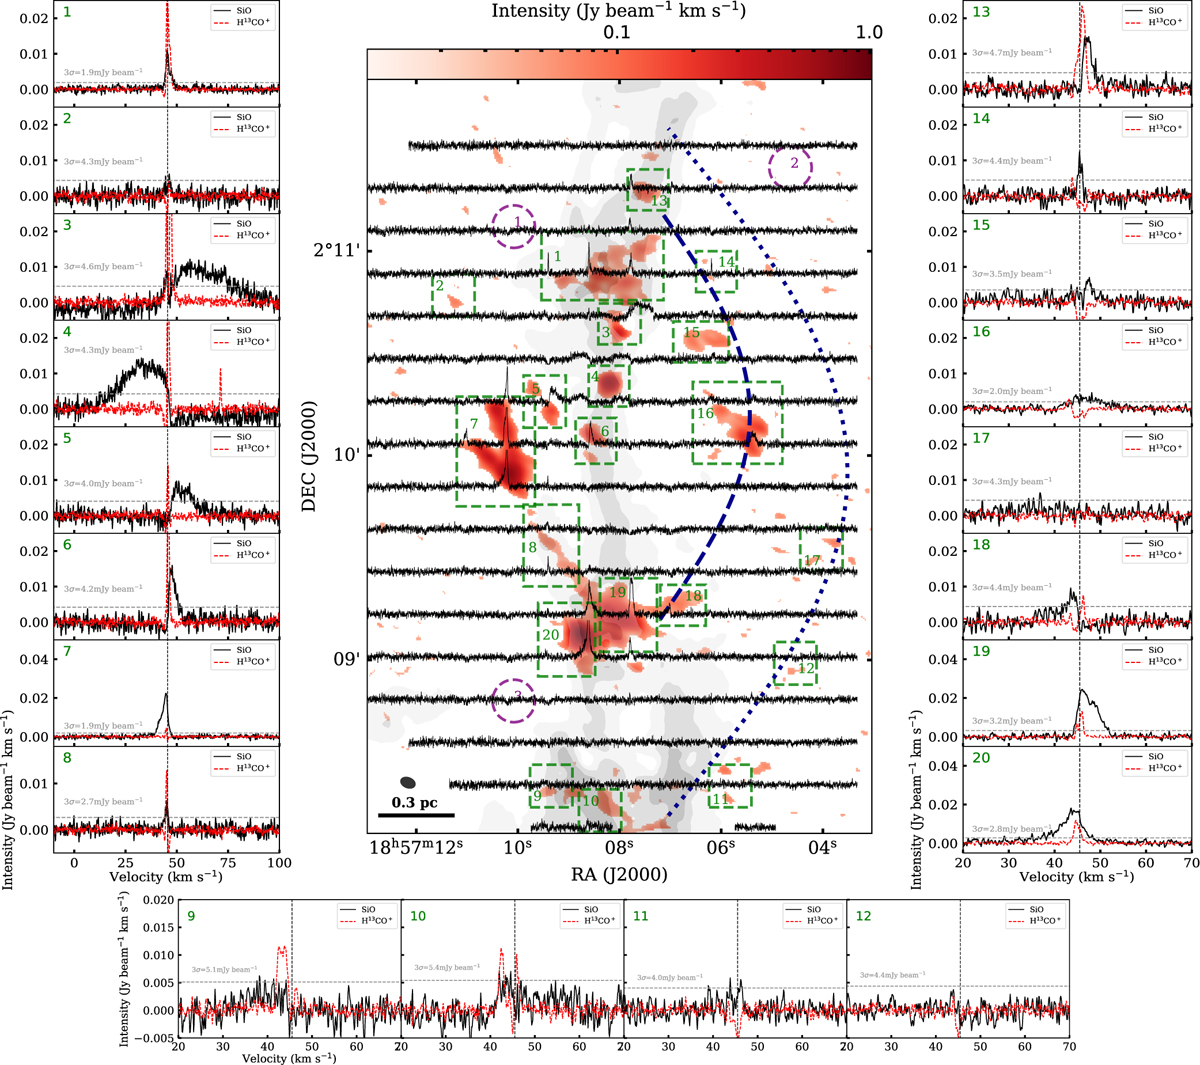
This figure shows the integrated intensity map of SiO and the averaged SiO spectra across Cloud H. The middle upper panel shows the SiO (2–1) integrated intensity map, with the SiO spectral grid overlaid. The grid size corresponds to 12″ × 12″. Gray contours represent the dense material, with contour levels of AV = 10, 20, 30, and 40 mag. Dark blue dashed and dotted lines trace the arc-like structures. Green dashed rectangles indicate the regions from which the SiO and H13CO+ spectra are extracted (shown in the left, middle lower, and right panels). The beam size (4.32″×2.93″) and the physical scale are shown in the lower-left corner. The left, middle lower, and right panels show the averaged spectra of SiO (black lines) and H13CO+ emission (red lines) extracted from the green dashed regions in the middle upper panel. The H13CO+ intensities have been divided by a factor of two for clarity. The green numbers in the upper-left corner of each panel correspond to the spectra extracted from the matching numbered green rectangles in the middle upper panel. The purple circles indicate regions with no detectable SiO emission. The gray dashed parallel line in each spectrum indicates the 3rms noise levels of the SiO emission. The vertical dashed black line marks the central velocity of Cloud H (45.5 km s−1).
Current usage metrics show cumulative count of Article Views (full-text article views including HTML views, PDF and ePub downloads, according to the available data) and Abstracts Views on Vision4Press platform.
Data correspond to usage on the plateform after 2015. The current usage metrics is available 48-96 hours after online publication and is updated daily on week days.
Initial download of the metrics may take a while.