Fig. 3
Download original image
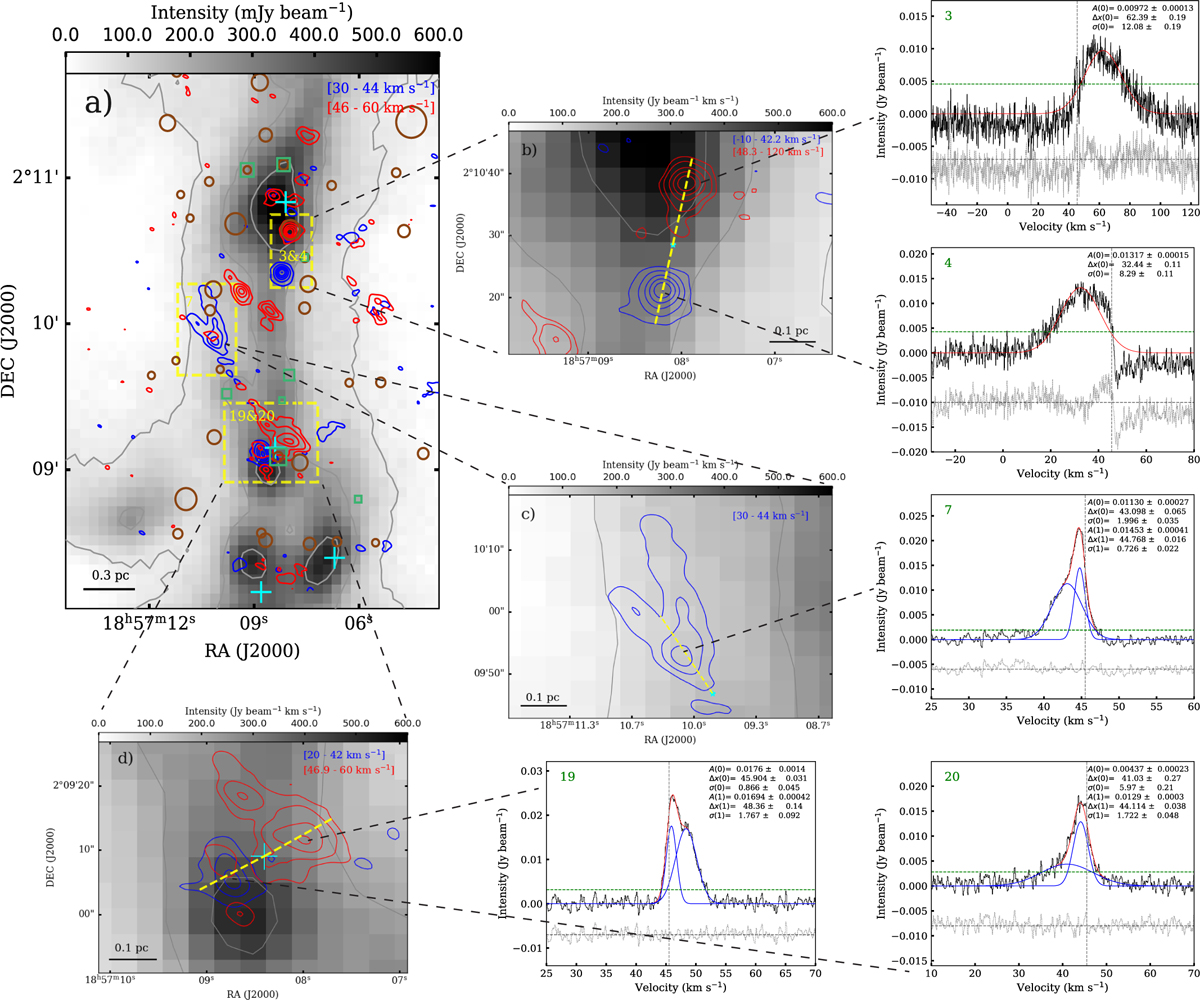
This figure presents the blue- and red-shifted integrated intensity maps of SiO emission and the corresponding spectra towards Cloud H. a): overview of the outflow regions across Cloud H. The background shows the 850 µm continuum emission within the ALMA field of view, with contour levels at 55 (∼5 σ), 220, 440 mJy beam−1. Blue and red contours represent the blue- and red-shifted SiO emission integrated over velocity ranges of 30–44 km s−1 and 46–60 km s−1, respectively, as indicated in the upper-right corner. The SiO contour levels start at 3σ (16 mJy beam−1 km s−1) and increase by 0.2Ipeak up to Ipeak (910 and 620 mJy beam−1 km s−1 for the blue and red contours, respectively). Yellow dashed rectangles mark the regions corresponding to the green rectangles in Figure 2, where outflows are identified. The dashed black lines indicate the zoomed-in view of the outflow region. Dark red open circles and medium green rectangles indicate the positions of 8 µm sources and 24 µm sources, respectively. Other symbols are the same as in Figure 1. b): zoom-in view of the outflow region at positions 3 and 4. The blue and red velocity ranges are shown in the upper-right corner. Yellow lines indicate the extents of the blue and red lobes, and the cyan star marks the position of the potential driving protostar, located centrally between the lobes. The two right panels indicated by dashed black lines show the SiO spectra with Gaussian fitting extracted from positions 3 and 4. The symbols are the same as Figure A.2. c): zoom-in view of the outflow region at position 7. The velocity range of blue-shifted SiO emission is noted in the upper-right corner. The right panel presents the corresponding SiO spectra with Gaussian fitting. d): zoom-in view of the outflow region at positions 19 and 20. The velocity ranges of blue- and red-shifted SiO emission are shown in the upper-right corner. The two right panels display the SiO spectra with Gaussian fitting extracted from positions 19 and 20.
Current usage metrics show cumulative count of Article Views (full-text article views including HTML views, PDF and ePub downloads, according to the available data) and Abstracts Views on Vision4Press platform.
Data correspond to usage on the plateform after 2015. The current usage metrics is available 48-96 hours after online publication and is updated daily on week days.
Initial download of the metrics may take a while.