Fig. 4
Download original image
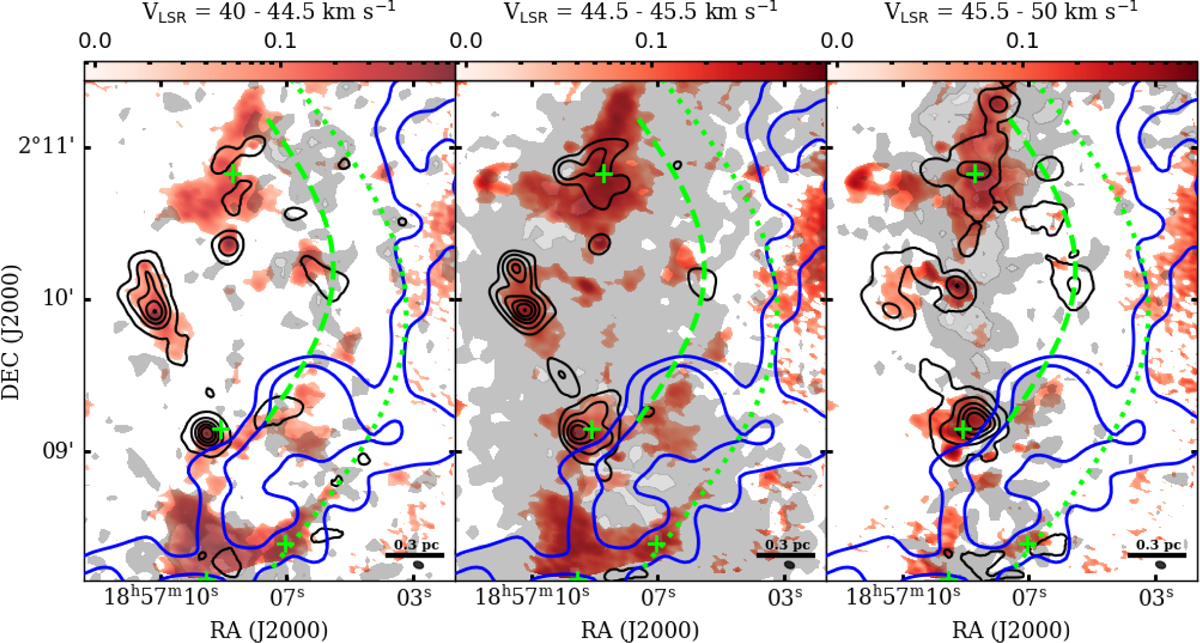
This figure shows the CS integrated intensity maps at different velocity ranges. The red background represents the CS integrated intensity, overlaid with SiO (2–1) emission (black contours) and C18O (2–1) emission (gray contours). The integrated velocity ranges from 40 to 44.5 km s−1 (blue-shifted gas; left panel), 44.5 to 45.5 km s−1 (ambient gas; central panel), and 45.5 to 50 km s−1 (red-shifted gas; right panel). SiO (2–1) black contour levels start at 3σ and increase by 0.2Ipeak up to Ipeak. The rms noise levels (σ) for the different velocity components are 7.4, 7.5, and 7.4 Jy beam−1 km s−1, and the corresponding peak intensities (Ipeak) are 1010, 288, and 877 Jy beam−1 km s−1, respectively. The C18O gray contour levels in the left panel are 0.738, 1.107, 1.476, and 1.738 K km s−1 (peak value). In the central and right panels, the contour levels are 0.322, 0.805, 1.127, and 1.44 K km s−1 (peak value), and 0.624, 0.936, 1.248, 1.56, and 1.75 K km s−1 (peak value), respectively. The blue contours display 610 MHz emission at 1.1 (5σ) and 1.54 (7σ) mJy beam−1 from Paredes et al. (2014). Green crosses mark the locations of the identified cores. Green dashed and dotted lines indicated the arc-like structures. The beam size and physical scale are displayed in each lower-right corner.
Current usage metrics show cumulative count of Article Views (full-text article views including HTML views, PDF and ePub downloads, according to the available data) and Abstracts Views on Vision4Press platform.
Data correspond to usage on the plateform after 2015. The current usage metrics is available 48-96 hours after online publication and is updated daily on week days.
Initial download of the metrics may take a while.